

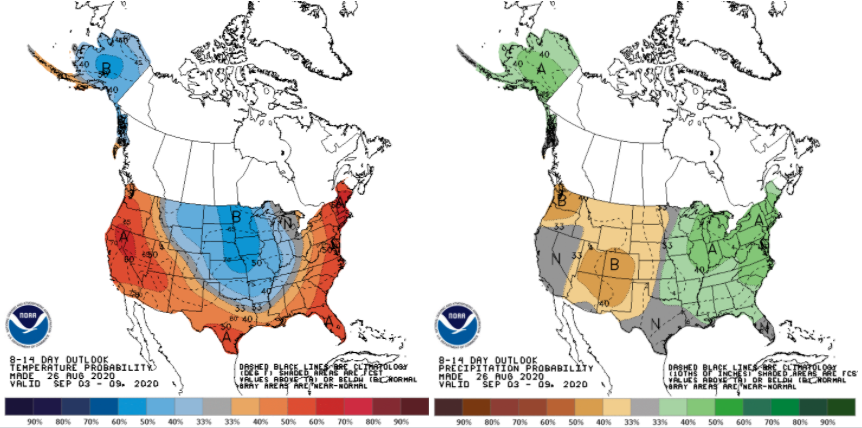
After the last several weeks of predominantly dry conditions, the national climate outlooks are finally showing confidence that temperatures should start shifting to cooler than normal and precipitation will be wetter than normal (Figure 1).
After the last several weeks of predominantly dry conditions, the national climate outlooks are finally showing confidence that temperatures should start shifting to cooler than normal and precipitation will be wetter than normal (Figure 1).
This past week has been so enjoyable temperature- and humidity-wise that it was easy to hope that it was going to stay this way for several more weeks.

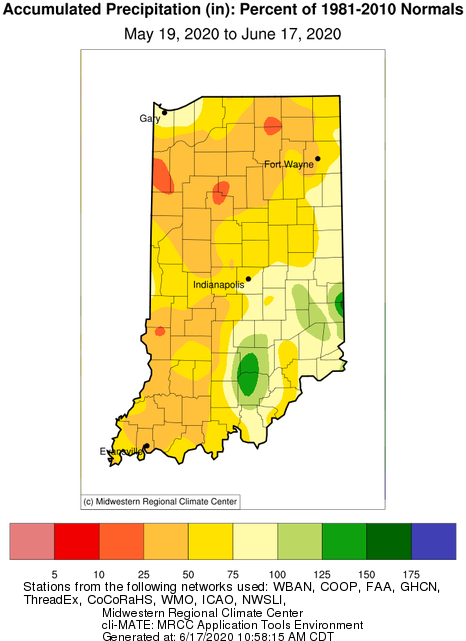
Rain moved across Indiana earlier this week, bringing much-needed precipitation to the northern counties.
The climate outlooks issued by the national Climate Prediction Center are keeping things exciting for those trying to plan ahead.
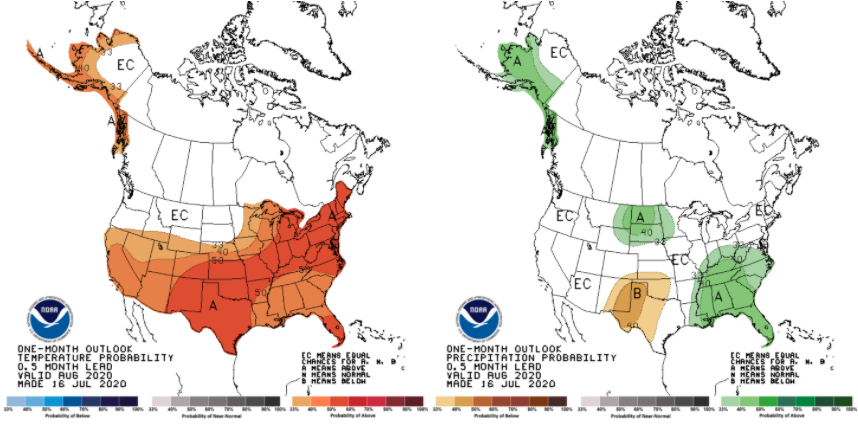
On July 16th, the national Climate Prediction Center released the climate outlooks for August (Figure 1) and the August-September-October (Figure 2) period.
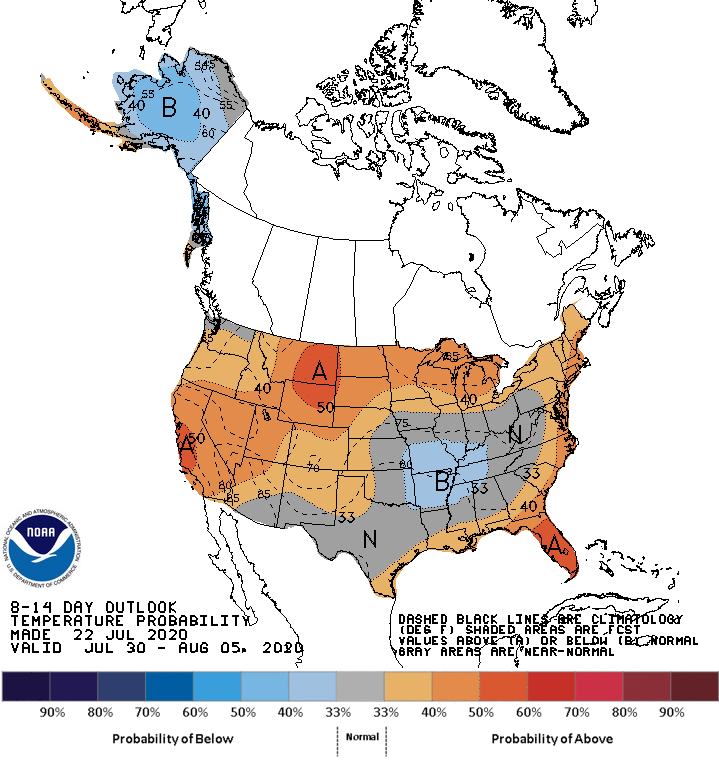
For the first time in what seems like months, the 8-to-14-day climate outlook is not showing significant confidence for above-normal temperatures in Indiana (Figure 1).
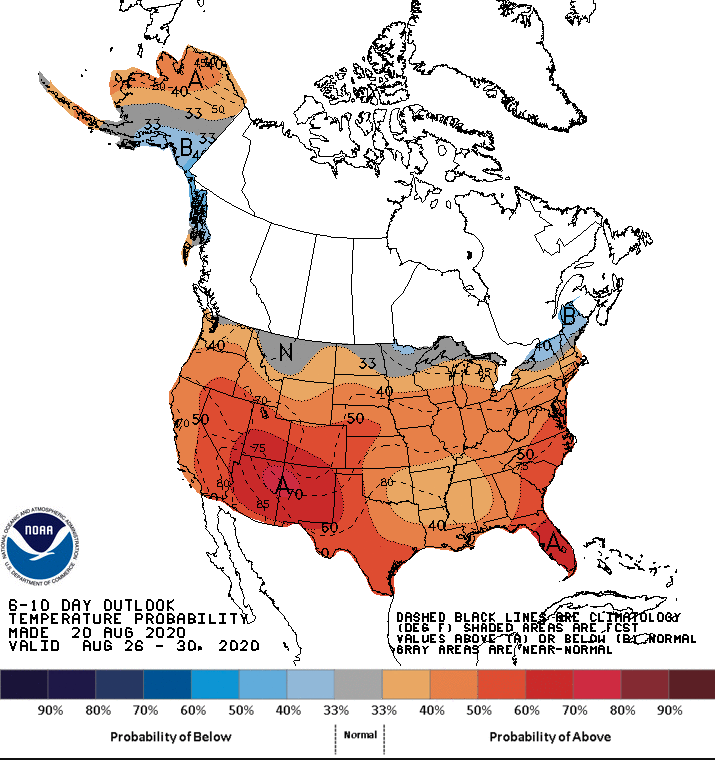
Indiana has been very dry the last several weeks (Figure 1) and conditions are starting to show in lawns and fields.
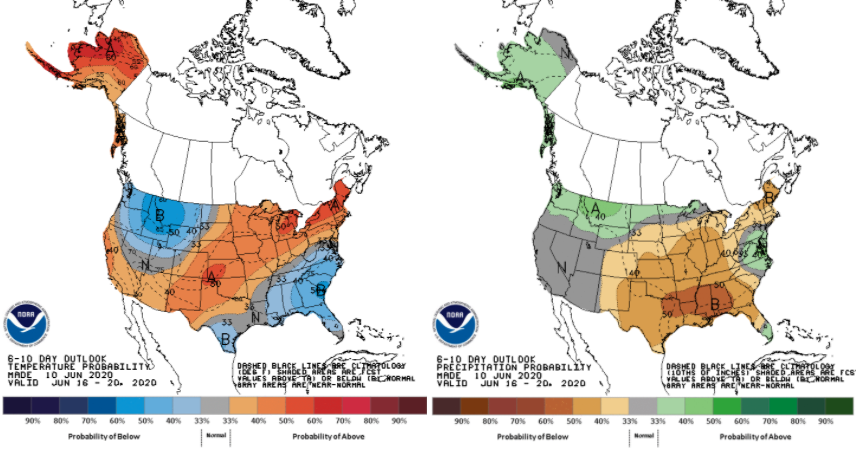
The forecasts and climate outlooks over the next several weeks is calling for below-normal precipitation and above-normal temperatures (Figure 1).
The month of May was sprinkled with a record-breaking freeze over Mother’s Day weekend, followed by heavy rainfall the following weekend, with a roller coaster of cool periods and extremely warm periods.
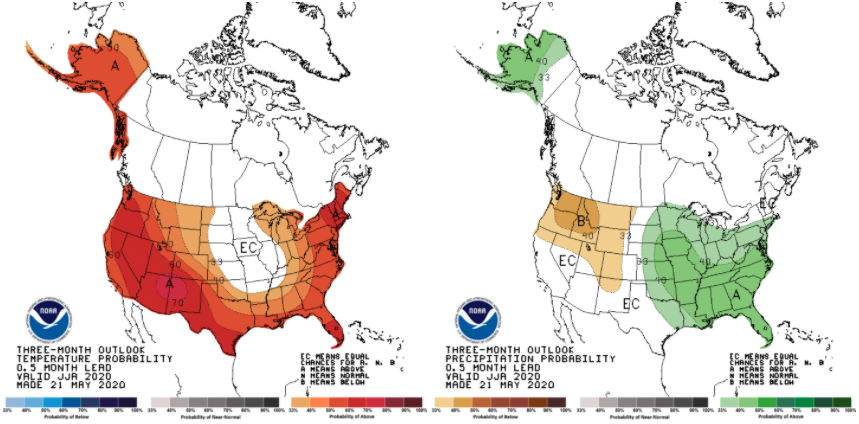
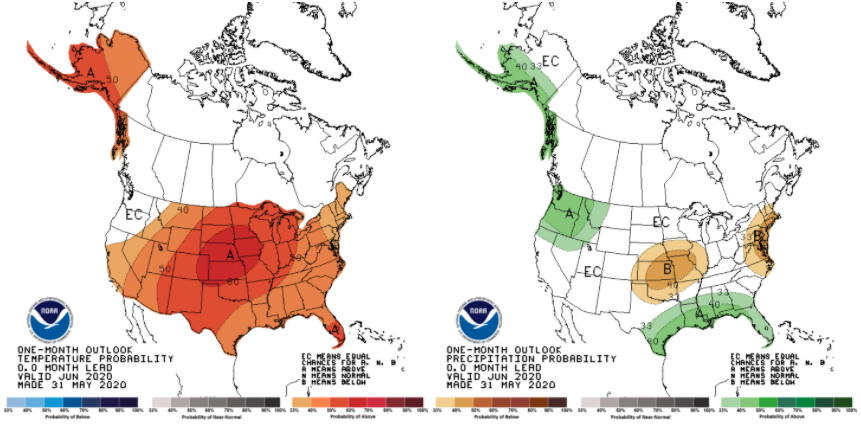
On May 21st, the national Climate Prediction Center released the June-July-August summer outlook for temperature and precipitation (Figure 1).
© 2026 Purdue University | An equal access/equal opportunity university | Copyright Complaints | Maintained by Pest&Crop newsletter
If you have trouble accessing this page because of a disability, please contact Pest&Crop newsletter at luck@purdue.edu.
