

After a welcomed break in the rain for most of the state over the last 7-10 days, that window will close again by this weekend. In fact, the 7-day precipitation forecast (Figure 1) is predicting 2”-4” across Indiana by next Thursday (June 20th). Beyond that date, the climate outlook is showing strong confidence that above-normal precipitation amounts will continue through the following week (June 25th) and into early July. Be prepared for pooling water and potential flash flooding!
How unusual has this spring been for Indiana? Believe it or not, this past March-May came in as the 11th wettest spring (15.52”) with respect to the 1895 through 2019 (125 years) time period! The record spring was in 2011 when 19.58” fell across the state (Figure 2). What is interesting to consider is in 2011, after the record-breaking March-June precipitation, the rain all but stopped falling for July through October (Figure 3). Could that happen again this year?
With regard to temperatures, Indiana has been near normal for the first half of June causing accumulated growing degree-days to be within 50 units of normal across the state. Climate outlooks are predicting strong confidence of below-normal temperatures for the end of June into early July.
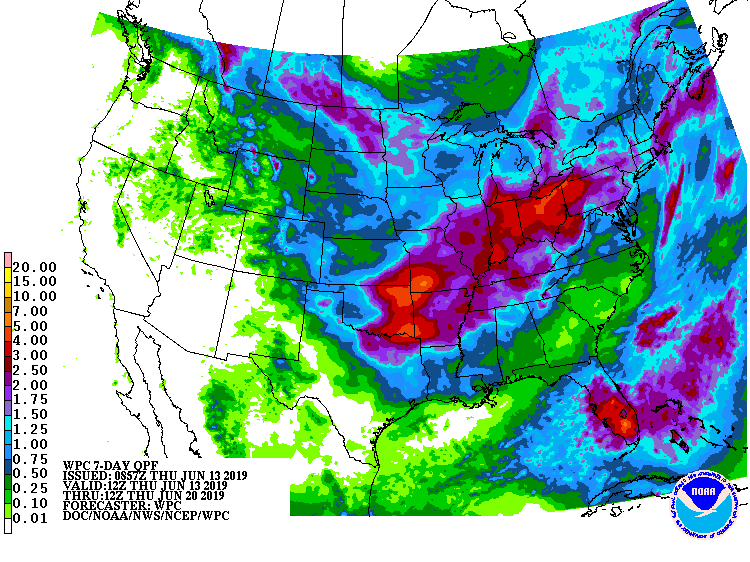
7-day precipitation forecast representing June 13 – 20, 2019. Source: NOAA Weather Prediction Center.

Time series of state-wide precipitation for Indiana for the spring months of March-May from 1895-2019.
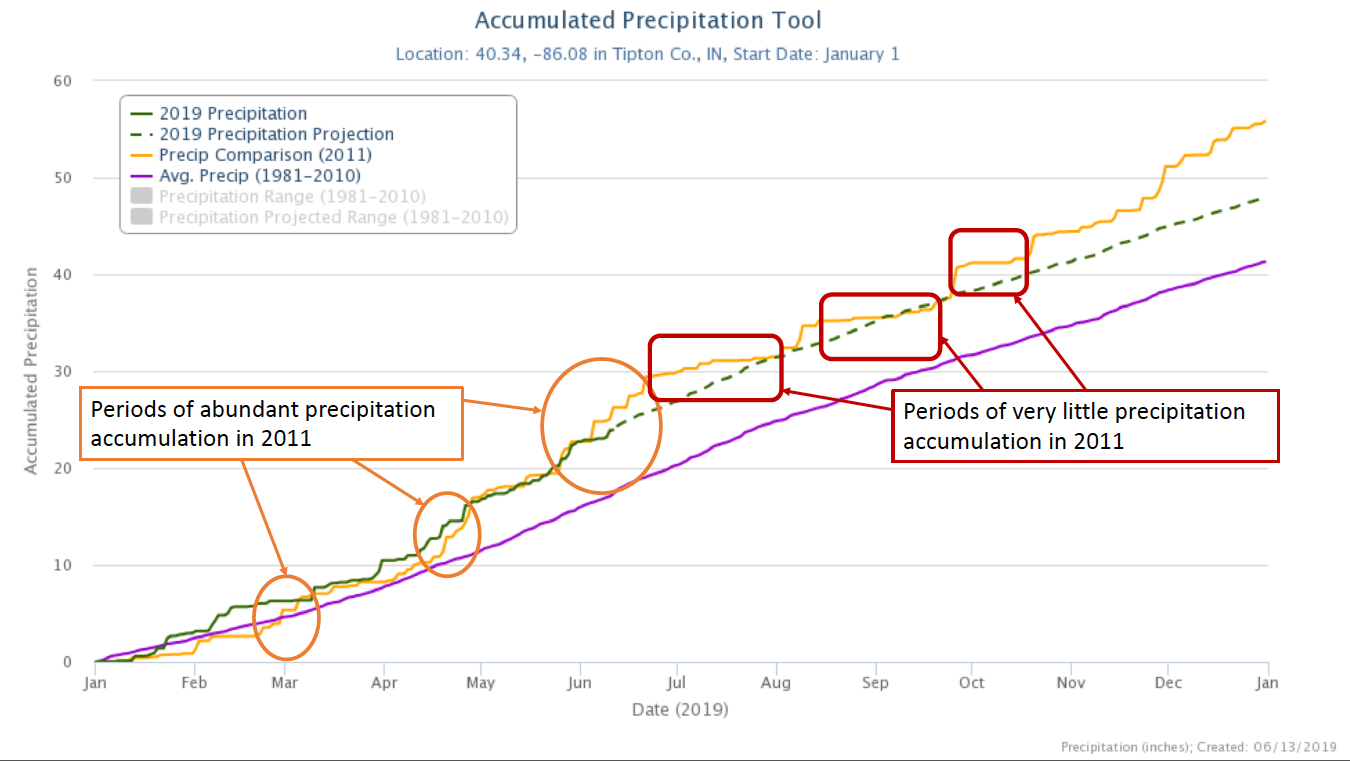
Comparison of precipitation accumulation between 2019 (green line) and 2011 (orange line). Purple line represents the average precipitation accumulation over the 1981-2010 period. The dashed green line represents a projection of the remainder of the 2019 calendar year assuming accumulation follows a rate similar to the climatological accumulation rate. Highlighted circles regions outlined by either circles or rectangles illustrate that while 2011’s accumulated precipitation exceeded 2019 leading into summer, the late-summer through mid-fall months experienced very little precipitation.
