

After the brutal heatwave hit us as June transitioned to July, any future above-normal temperatures may seem normal for this time of year.
After the brutal heatwave hit us as June transitioned to July, any future above-normal temperatures may seem normal for this time of year.
Our first significant heat wave hit Indiana this week with the added benefit of high humidity.
The average spring (March–May) temperature in Indiana was 55.9°F, which was 4°F above the 1991–2020 normal.
Indiana has seen several rounds of severe weather, and many are likely ready for a break.
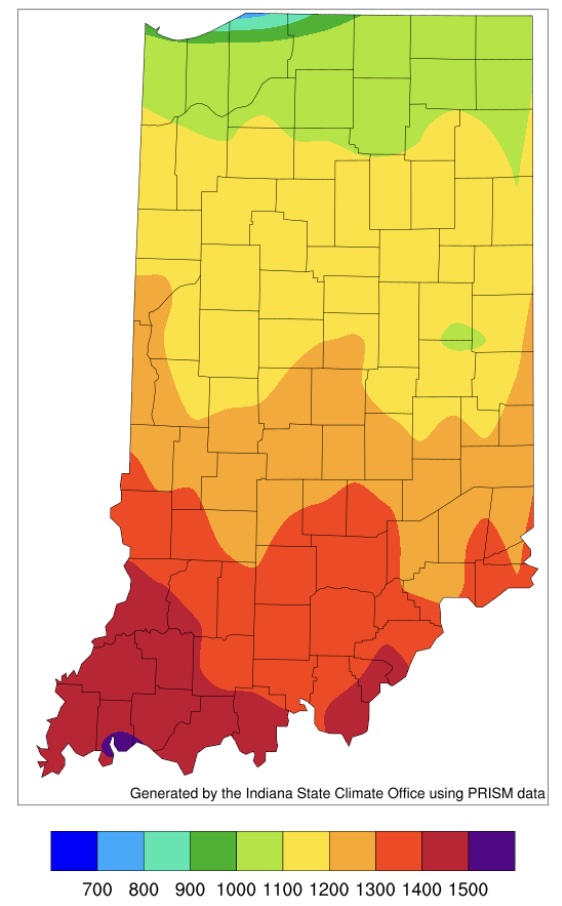
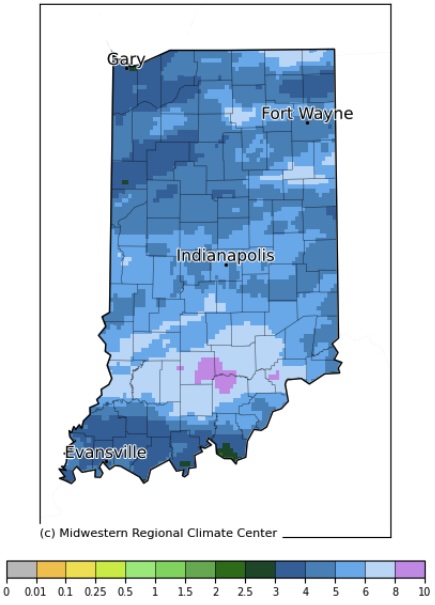
Since last Friday, many parts of Indiana have seen a significant amount of rain (Figure 1).

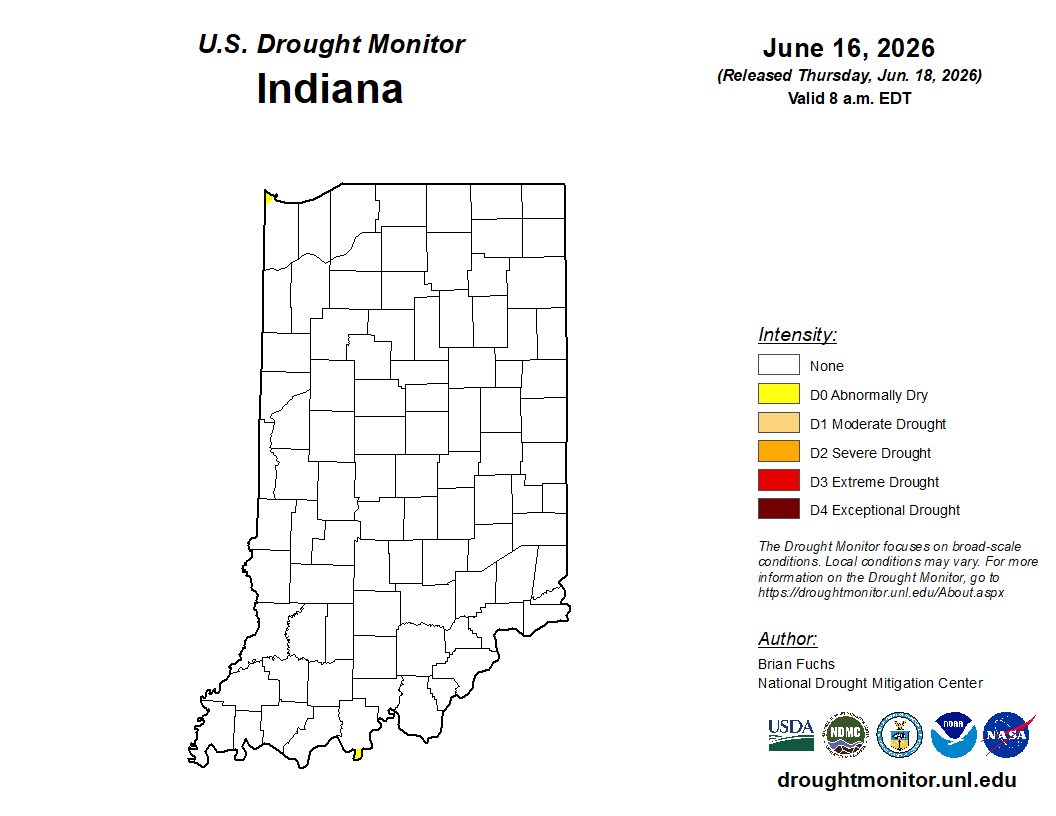
The term “flash drought” has become popularized in recent years to describe a rapidly intensifying drought situation.

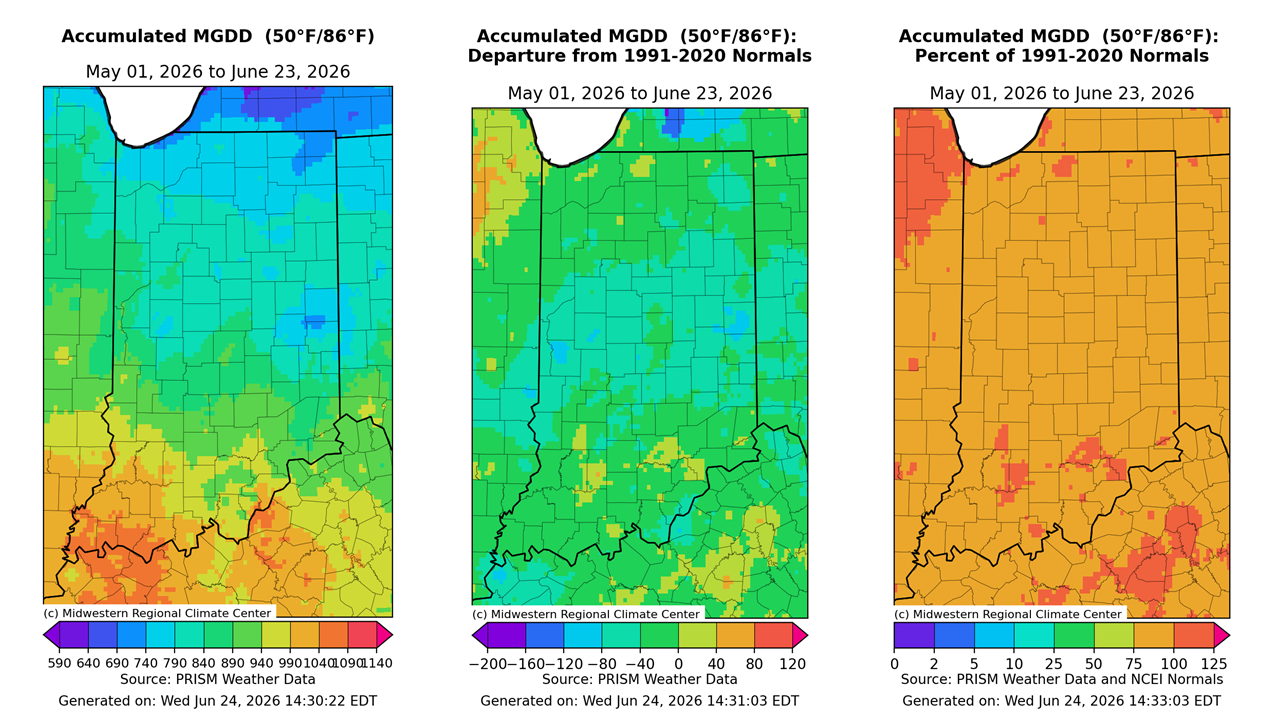
Temperatures across Indiana averaged 2°F below normal during the past 30 days (April 28–May 27) (Figure 1).

Recent rounds of thunderstorms have brought highly variable rainfall totals across Indiana, continuing a familiar spring pattern of “haves and have-nots” when it comes to precipitation.
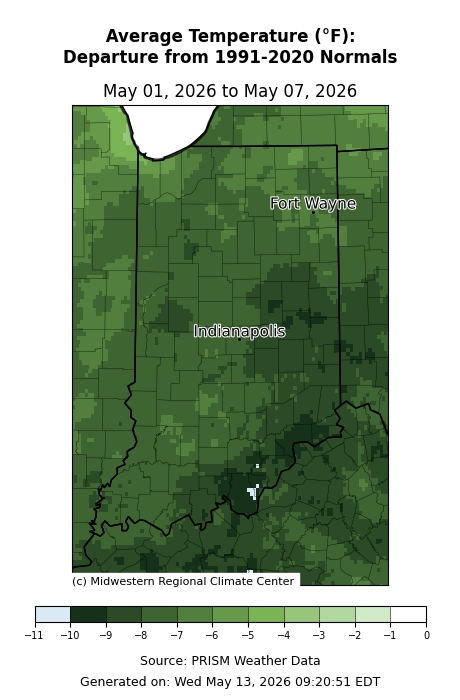
The first week of May certainly didn’t feel like May as temperatures ended up 5-10 deg F below normal across the state (Figure 1).
After another rainy start to the week, some of you may be ready for a few dry days to get out in the garden or field to start planting.
© 2026 Purdue University | An equal access/equal opportunity university | Copyright Complaints | Maintained by Pest&Crop newsletter
If you have trouble accessing this page because of a disability, please contact Pest&Crop newsletter at luck@purdue.edu.
