

Early spring flowers have already cycled through, I’m on record pace for mowing my yard, and field activity has been delayed due to a wet April.
Early spring flowers have already cycled through, I’m on record pace for mowing my yard, and field activity has been delayed due to a wet April.
There is some very exciting news this week for Indiana with respect to the U.S. Drought Monitor. For the first time since April 25, 2023, the entire state is void of any Abnormally Dry (D0) or Drought (D1-D4) conditions.
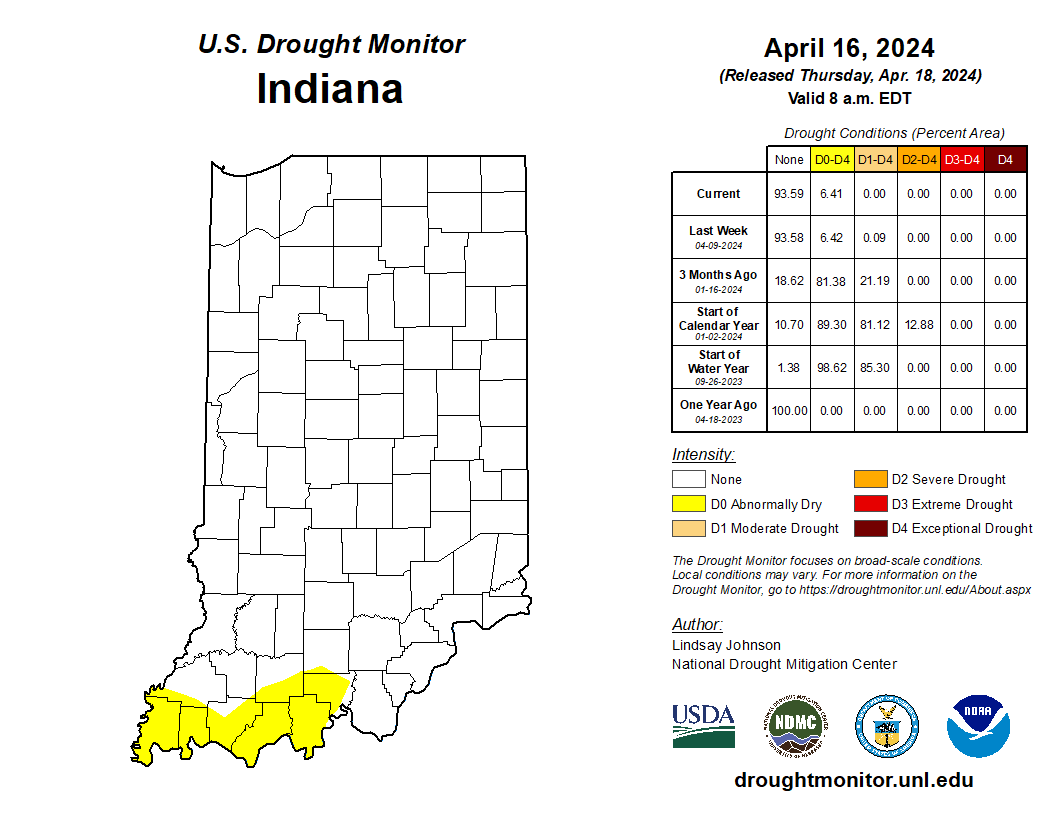
There was an interesting conversation among drought experts this week about how best to communicate drought, particularly when surface conditions appear so saturated.
Something exciting happened this past Monday that many of you might be glad is over and no longer filling your news feed – the total solar eclipse.
An old saying predicts that March will go out “like a lamb”. Another saying predicts April’s wetness with “April showers bring May flowers”.
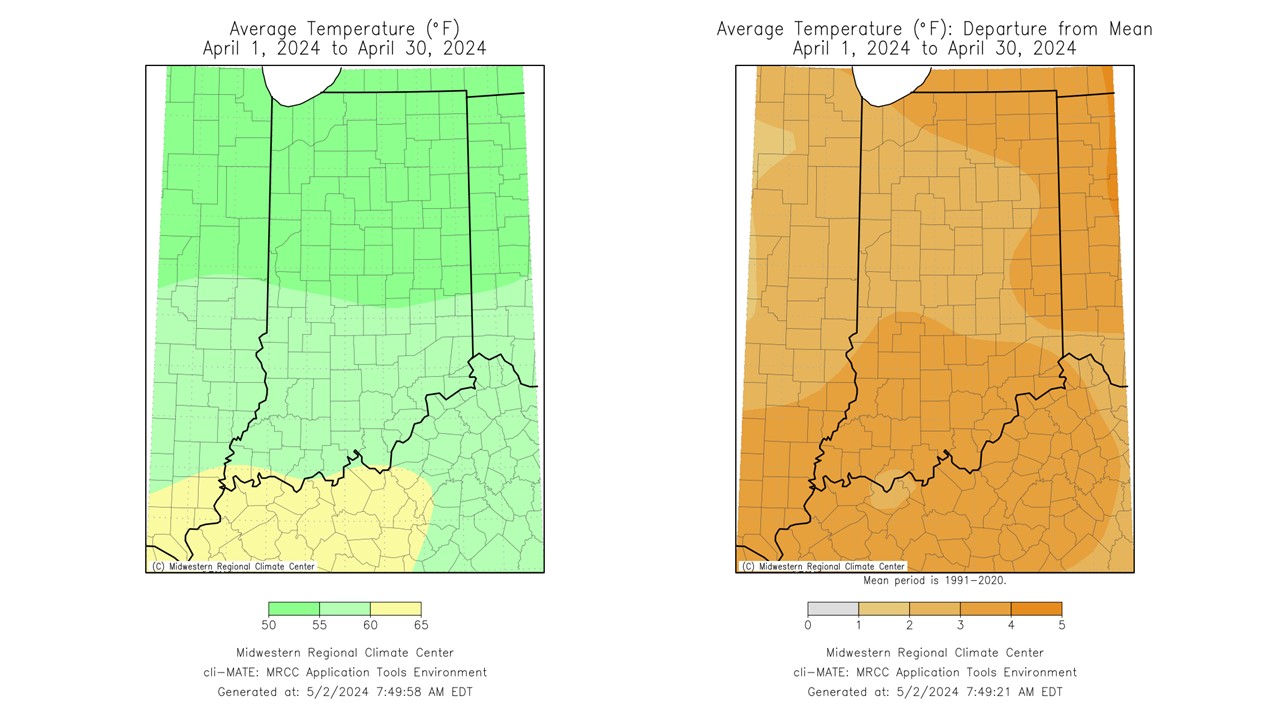
This spring is likely to be more of a tale of individual months than of a season. For the three-month period of March, April and May, the national Climate Prediction Center (CPC) predicts Indiana to be warmer and wetter than the climatological average conditions.
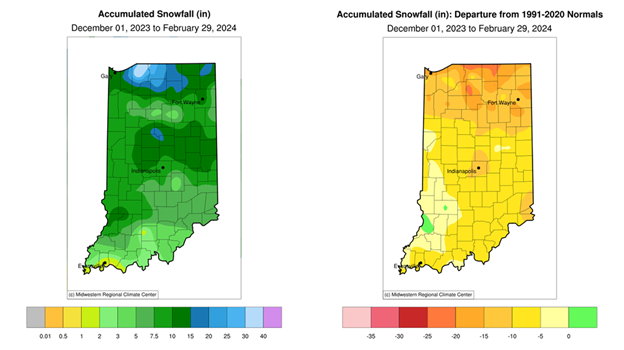
The 2023-2024 meteorological winter (December, January, and February) has concluded, but it seems as if we only experienced a couple weeks of winter-like weather this season.
Certainly, this incredible inconsistency that our atmosphere has been exposing us to is not unusual for the Midwest. That does not make it any less jarring, though, to go from needing to wear sweaters and a coat to then forgetting that coat at the office because the weather got warmer.
Recent weather maps
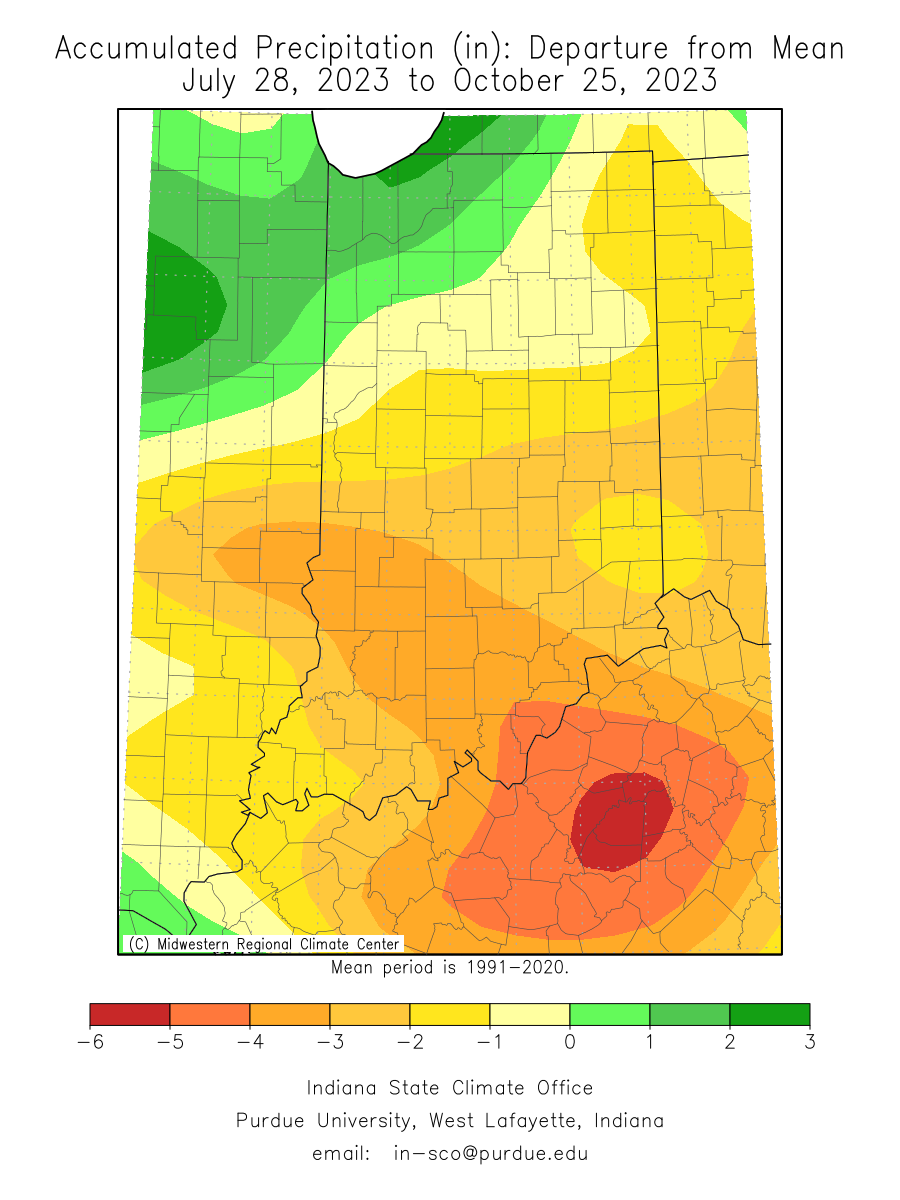
To say the last few months have been dry is a bit of an understatement. Since August 1st, only a sliver of Newton and Benton counties (northwest Indiana) and the tiniest speck of Warrick County (southwest Indiana) have had above-normal precipitation.
© 2026 Purdue University | An equal access/equal opportunity university | Copyright Complaints | Maintained by Pest&Crop newsletter
If you have trouble accessing this page because of a disability, please contact Pest&Crop newsletter at luck@purdue.edu.
