

This week has made me long for the time when I lived in Reno, Nevada. Further north and higher in elevation than Las Vegas, the climate was absolutely beautiful – particularly if you are not into green vegetation, bugs, and drink coasters. Reno was never quite as hot as Las Vegas, but still had the dry heat that made 90-degree days quite enjoyable, particularly when they were followed by 50-degree nights begging for jackets and a sweatshirt. This Midwest mugginess certainly brings out the bugs (window screens are mostly used for child protection and not bugs in the west) and did you know drink coasters aren’t necessary in dry environments? That is because there is not enough moisture (humidity) in the air to condense around a cold drink. In a previous article, I mentioned how dew-point temperature is one of the best indicators of how humid the air is. Those dew-point temperatures have passed 80°F again this week and we’re seeing evidence of this on our fogged-up windows (assuming you’re running your air conditioning below 80°F) and eyeglasses when coming indoors. This week, not only have we experienced consecutive days with dew-point temperatures over 80°F, but our nights have not been cooling off well, either. This can cause significant heat stress on humans, livestock and other animals, and our energy bills!
The climate outlooks are showing strong confidence that these hot temperatures will continue for a while. Precipitation outlooks, on the other hand, are favoring the probability for below-normal precipitation. However, that does not always translate to lower humidity. As we have seen over the last few days, rain does not always correspond with high humidity. Therefore, if the atmospheric flow continues to pull moisture in from the Gulf of Mexico, these high dew-point temperature days are likely to continue! The July climate outlooks continue to favor above-normal temperature (Figure 1) and below-normal precipitation (Figure 2), but the confidence is slightly weaker for that period compared to the confidence for both conditions to continue for the rest of June. The precipitation forecast over the next 7 days (Figure 3) is predicting less than 0.5” of rain across Indiana, with the greater amounts focused on southwest Indiana. There are early concerns of a rapid intensification of drought (“flash drought”) occurring over the next few weeks, so keep an eye on those forecasts and start preparing now for that potential to occur.
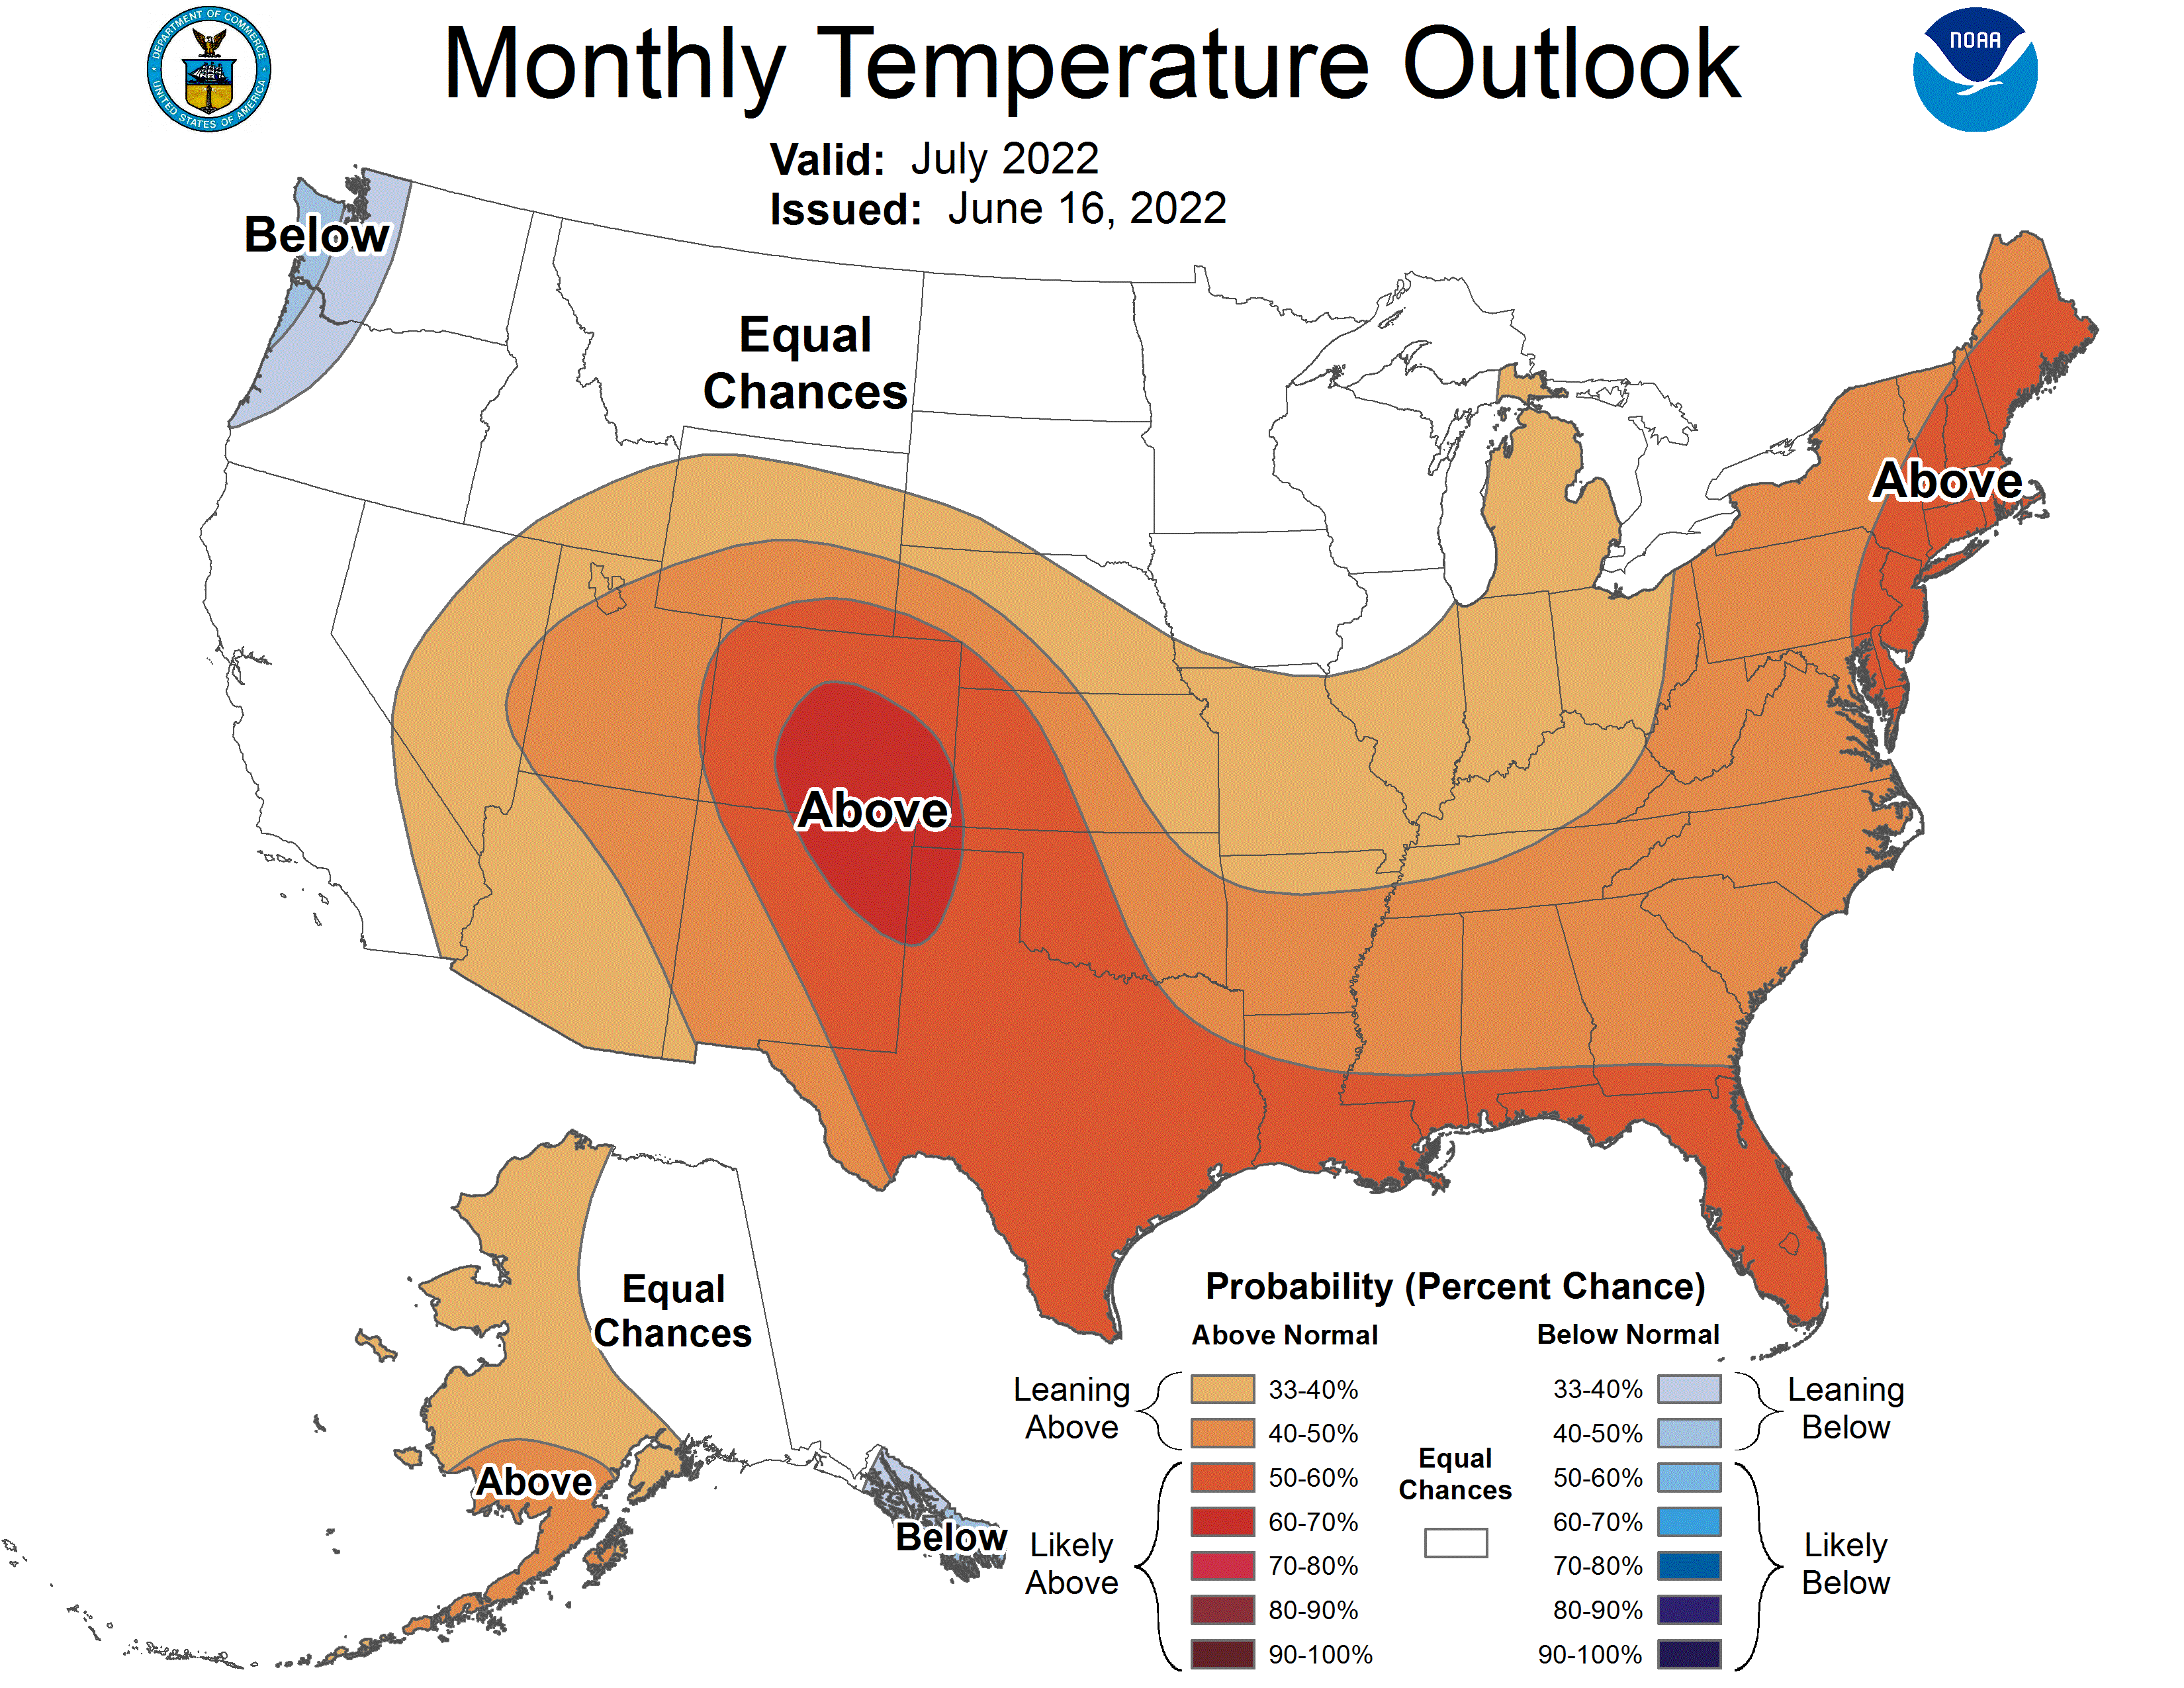
Figure 1. Temperature outlook for the July 2022. These are produced by the national Climate Prediction Center and illustrate confidence of favoring above- or below-normal conditions.
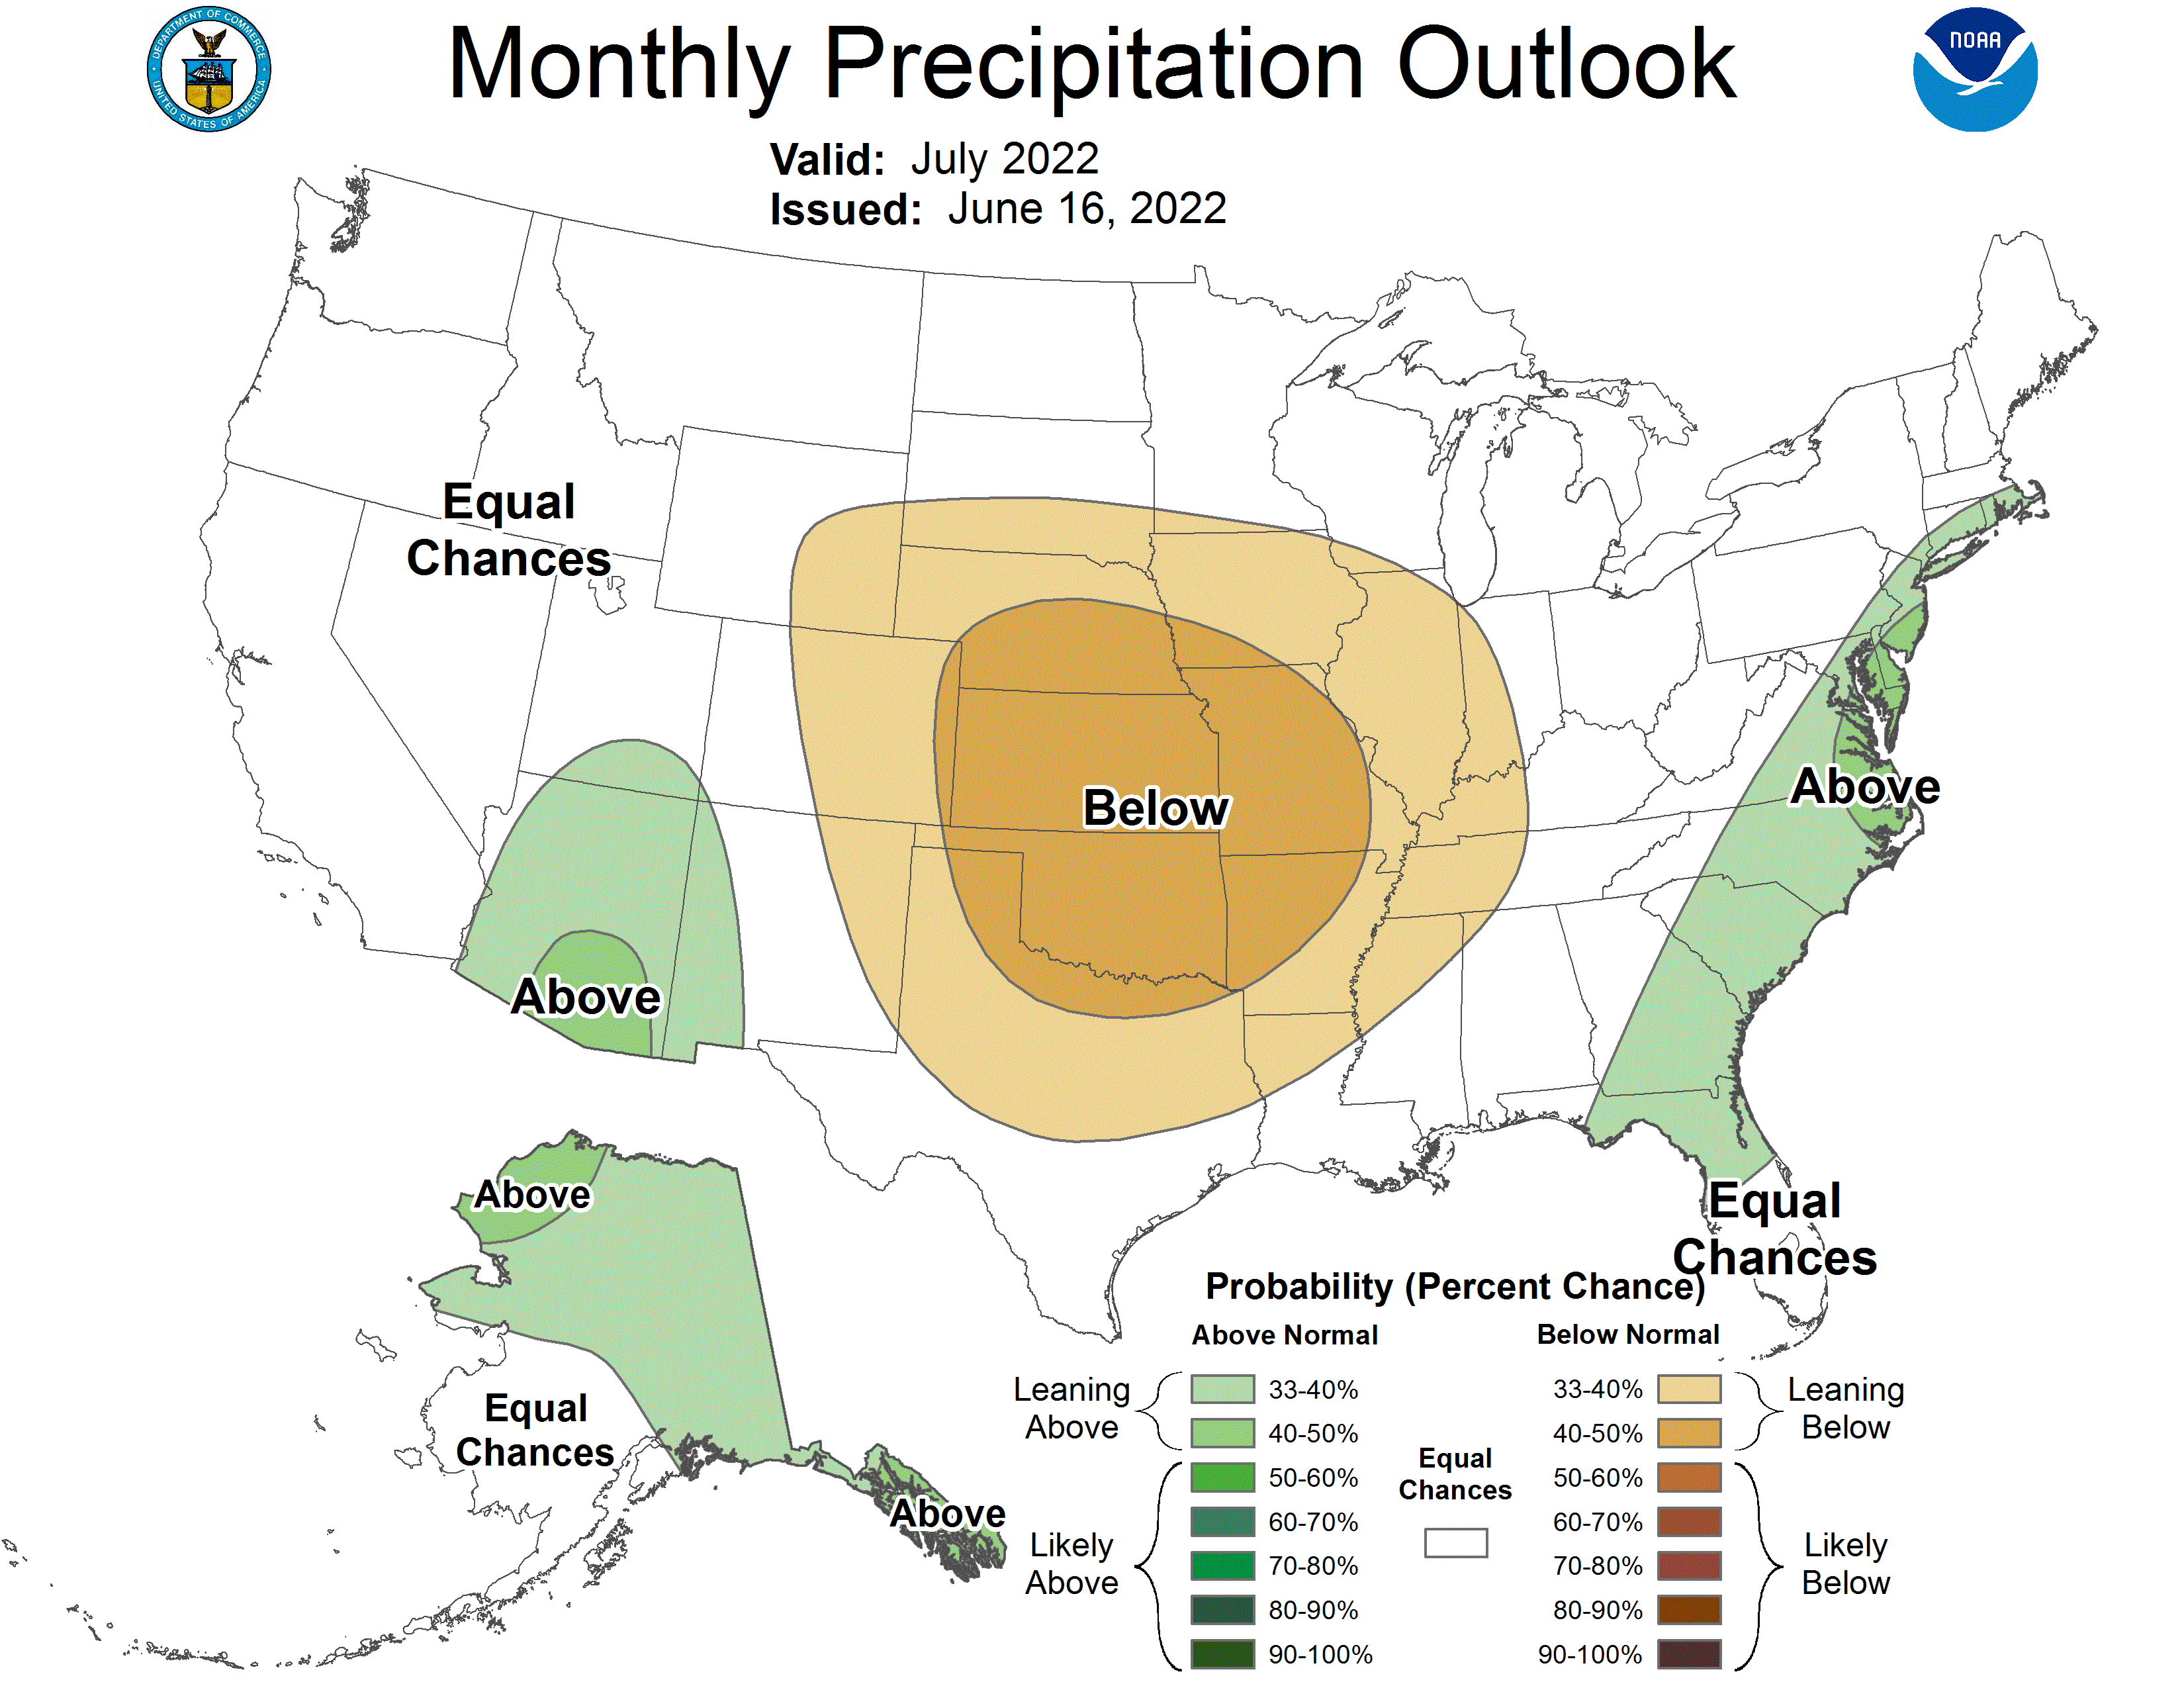
Figure 2. Precipitation outlook for the July 2022 period. These are produced by the national Climate Prediction Center and illustrate confidence of favoring above- or below-normal conditions.
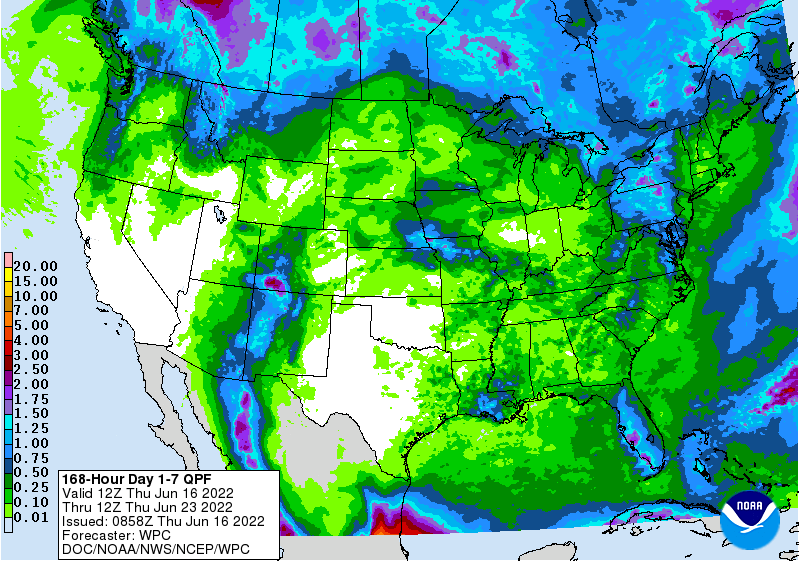
Figure 3. Quantitative precipitation forecast (in inches) for June 16-23, 2022. Source: National Weather Service.
Modified growing degree-day values continue to accumulate (Figure 4). When considering a start date of April 15th, the southern two-thirds of Indiana is 20 to 80 units ahead of the 1991-2020 climatological normal (Figure 5).
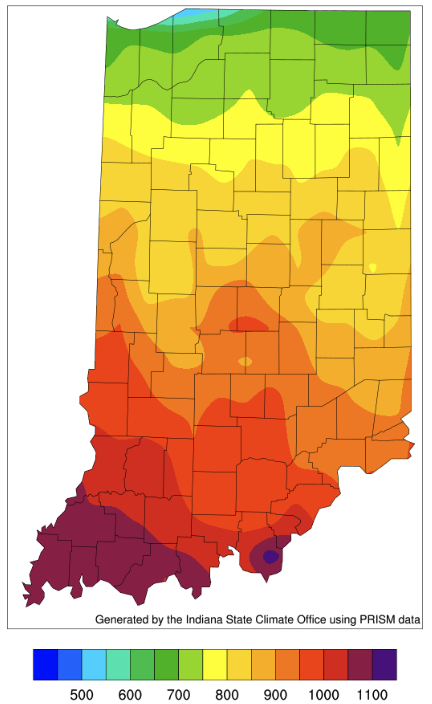
Figure 4. Modified growing degree day (50°F / 86°F) accumulation from April 15-June 15, 2022.
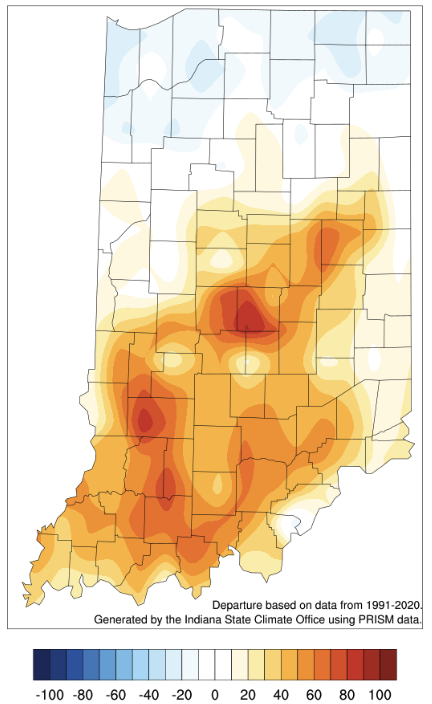
Figure 5. Modified growing degree day (50°F / 86°F) accumulation from April 15-June 15, 2022, represented as the departure from the 1991-2020 climatological average.
