

After nearly 38 years as Purdue IPM Specialist, it is time for me to write my last Pest&Crop article.
After nearly 38 years as Purdue IPM Specialist, it is time for me to write my last Pest&Crop article.
What do you think of when you hear the word climate? I would guess answers would range from ‘average weather conditions’ to ‘hot, muggy summers’ to ‘climate change’ to ‘environmental policies and politics’. What a range! Fields of climate can vary from paleoclimate studies (e.g., ice cores and tree rings), to applied climate science (e.g., architectural design and vector-borne diseases like West Nile Virus and Malaria), to climate modeling (e.g., lots of physical equations and computers), to climate change (e.g., ‘but the polar bears, Daddy!’), to climate services (e.g., data translated into information). Among all this diversity, the common thread is the consideration and correlations of what has occurred in our atmosphere historically to better understand and prepare for current and future decisions. Since the late 1800s, our country has had an organized effort to collect observational data (e.g., temperature and precipitation) at hundreds of locations so we can monitor[Read More…]
Pest managers throughout Indiana should be scouting their alfalfa for leaf feeding from weevil larva.
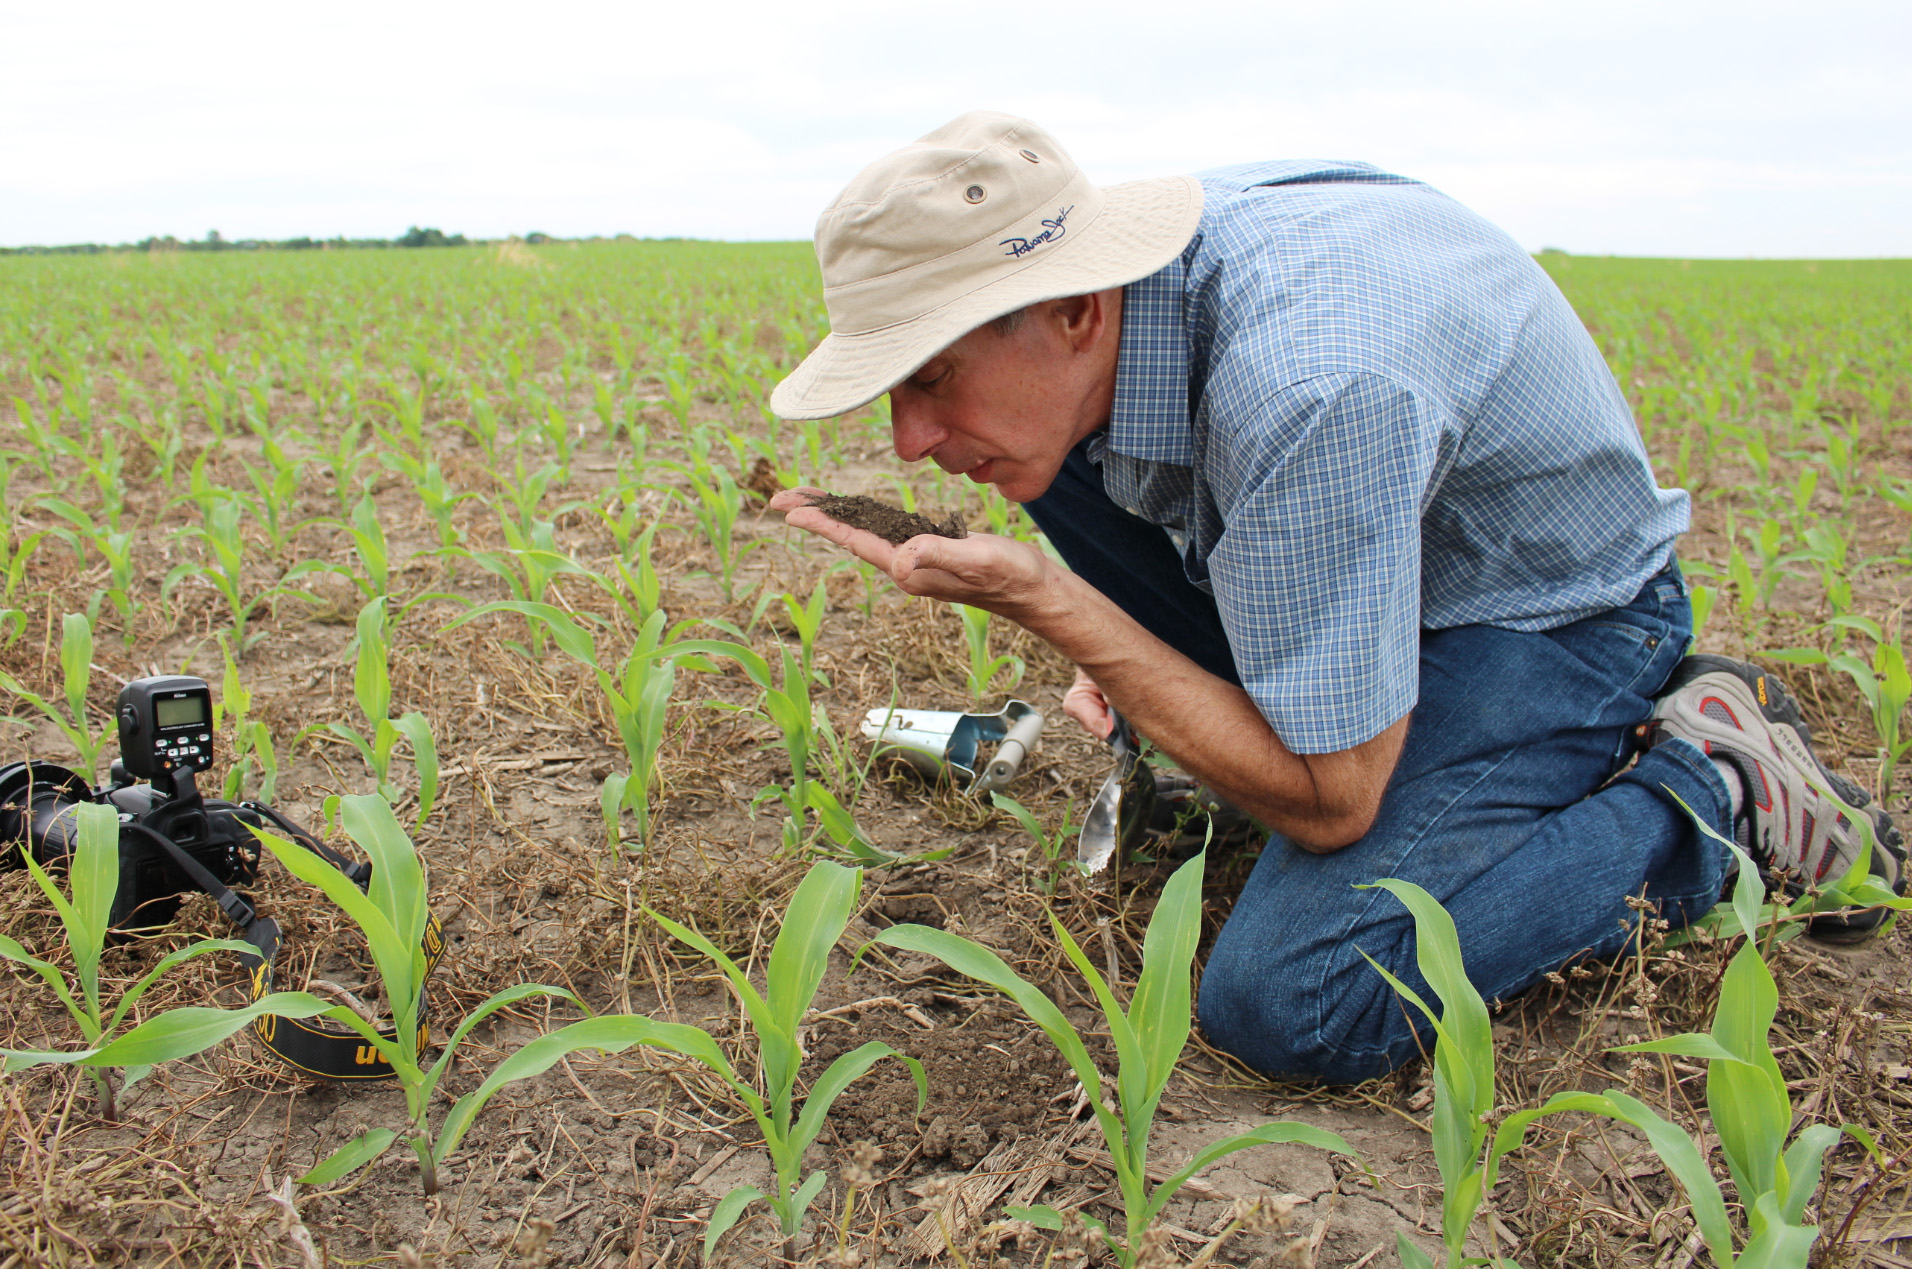
Increasing interest in practices like cover cropping and soil health includes challenges across a range of agronomic factors, including pest management.
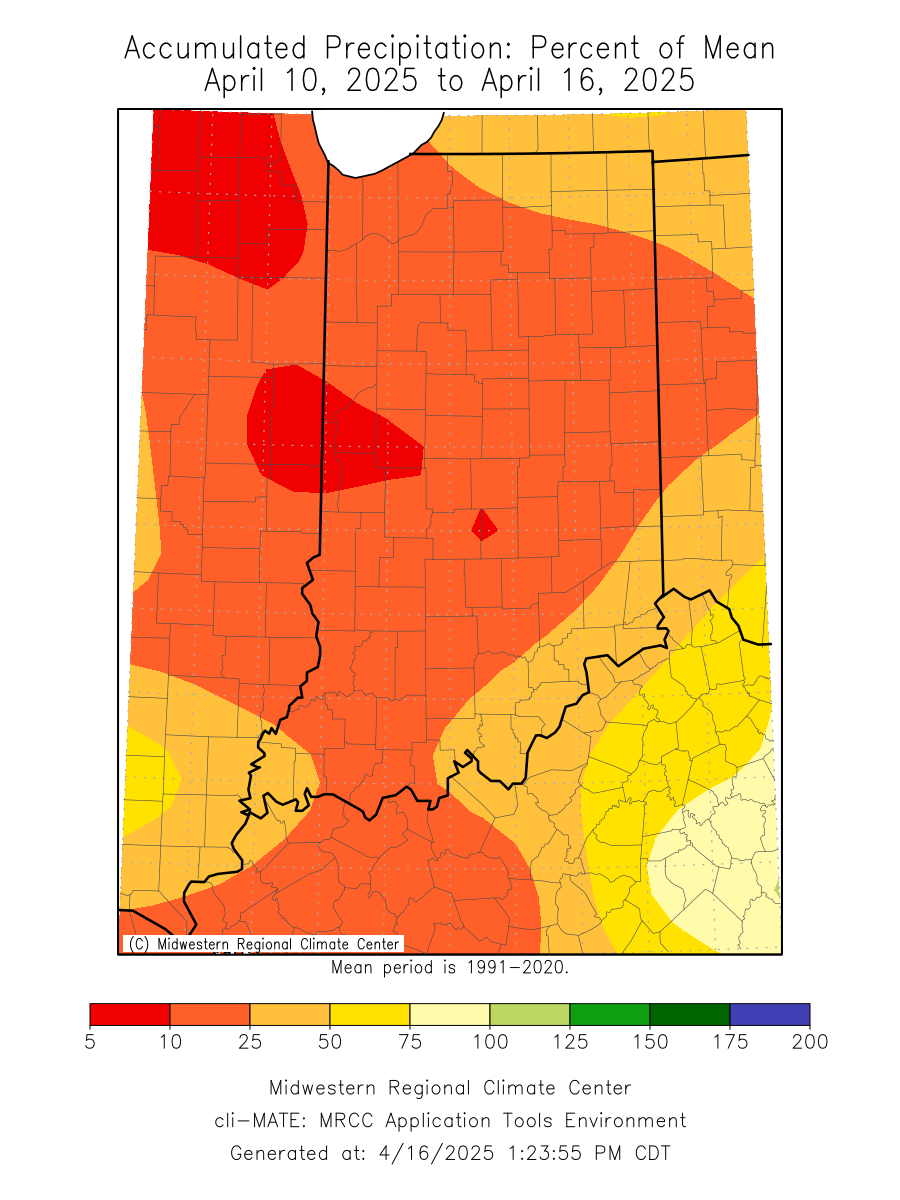
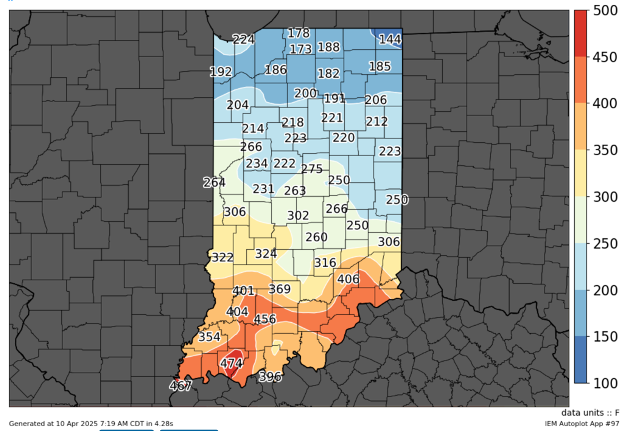
Despite the wet start to the month, the entire state saw less than 50 percent of normal rainfall from April 10 to 16, and in some cases, less than 10 percent of normal rainfall (Figure 1).
Hemp continues to draw interest from stakeholders in Indiana and elsewhere.
Pest managers throughout Indiana should be scouting their alfalfa for leaf feeding from weevil larva.
Increasing interest in practices like cover cropping and soil health includes challenges across a range of agronomic factors, including pest management.
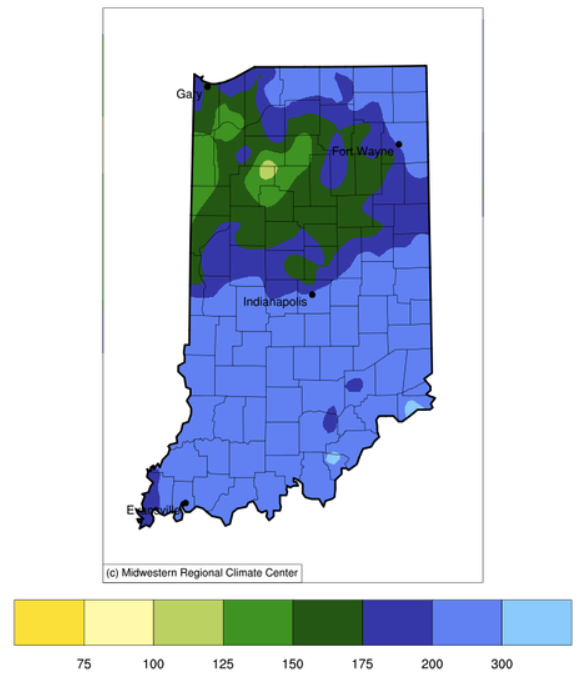
There is the common adage “April showers bring May flowers”. Apparently, Mother Nature utilized a rather liberal definition of “showers” last weekend and the end of last week by dumping over seven inches of rain in southern Indiana.
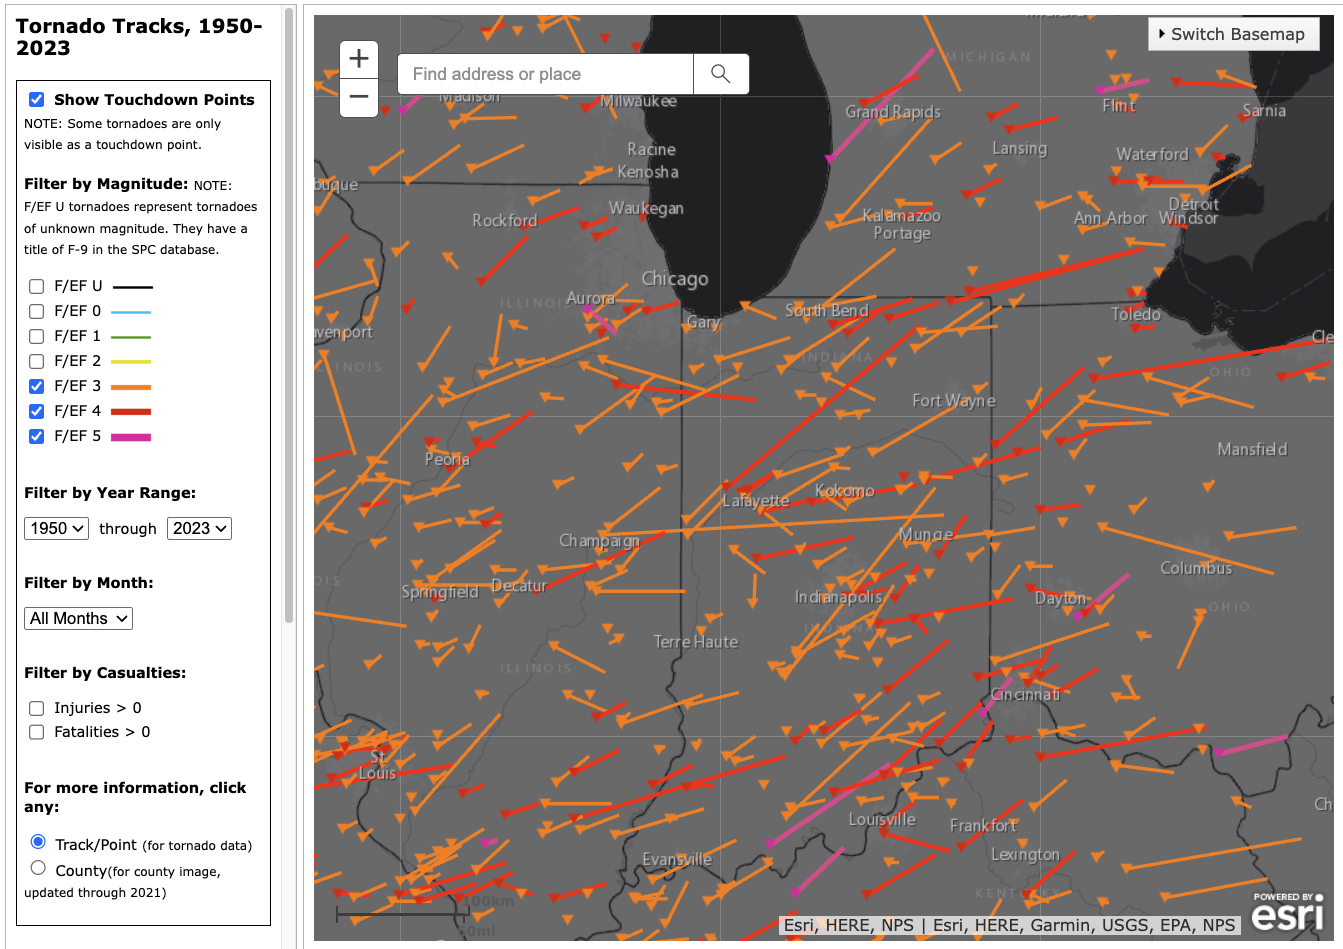
Indiana has already experienced several tornadoes this year with more certainly to come. Of course, this is not unusual since Indiana is often considered on the far northeastern edge of “Tornado Alley”.
© 2026 Purdue University | An equal access/equal opportunity university | Copyright Complaints | Maintained by Pest&Crop newsletter
If you have trouble accessing this page because of a disability, please contact Pest&Crop newsletter at luck@purdue.edu.
