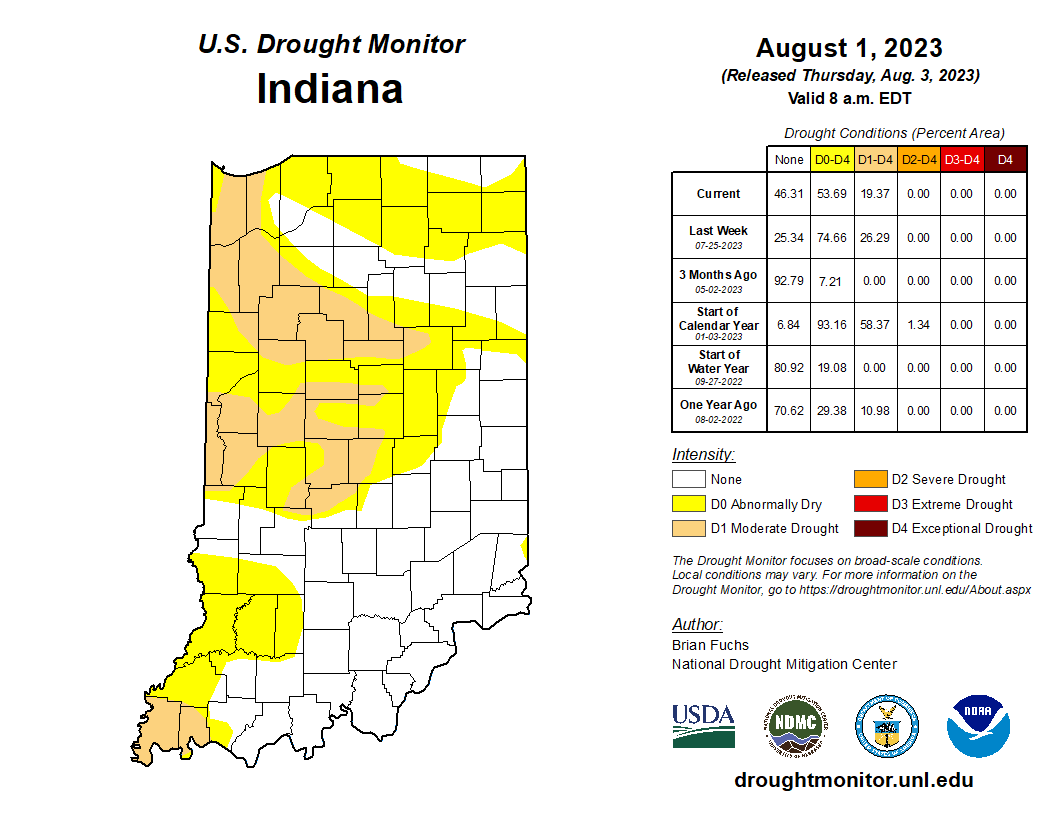
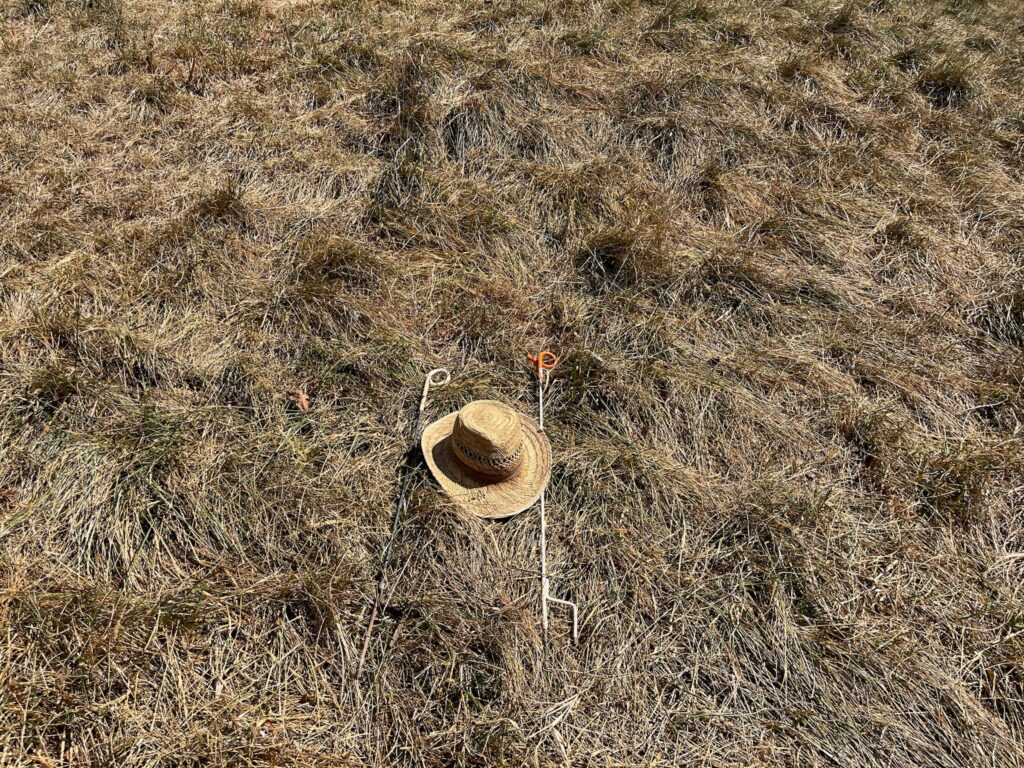
Over the last 30 days (July 18-August 15), the state average temperature was 73.5◦F, which was essentially normal.
37 articles tagged "drought".
Drought and abnormally dry conditions continue to improve across most of Indiana (Figure 1).
Recent precipitation events have allowed periodic rainfall to hit most places across Indiana.
After another week of decent rains across the state (Figure 1), abnormally dry and drought conditions continue to improve according to the latest U.S. Drought Monitor (Figure 2).
Timely rains have returned over the past few weeks and have helped crop conditions across the state.
A couple of weeks ago I had conversation with several State of Indiana Farm Service Agency (FSA) employees.
For the past seven weeks, abnormally dry conditions gradually spread and intensified across Indiana to eventually cover over 98% of the state.
Below-normal temperatures continued through the first 21 days of June as the state average temperature was 68.3°F, which was 1.8°F below the 1991-2020 climatological normal. Temperature departures were 1-5°F below normal across the state, with larger departures in eastern and southern Indiana (Figure 1, Left). Maximum temperatures were near normal for the entire state, and minimum temperatures ran 1-9°F below normal (Figure 1, Right). Dry air and limited overnight cloud cover are to blame. Several locations measured minimum temperatures in the 40s at some point this month, but Franklin County recorded a chilly 36°F on June 9th. This station also tied with Shelby County for the second highest temperature recorded so far this month, 95°F, which occurred on June 3. Dubois County hit 97°F on June 4th. There were more than 20 daily low temperature records broken or tied during the second week of June. Over the last week, maximum[Read More…]
The last several weeks have seen very little precipitation across Indiana. Figure 1 illustrates how much was received compared to the climatological normal amount from May 9 through June 7. The entire state received amounts less than normal (where normal would be 100 percent on the map) with central and northeastern Indiana having received less than 25 percent of normal amounts. This has resulted in browning lawns, lowered ponds and streams, and most vegetation starting to look stressed. Why is this happening and how long will it last? While the El Niño – Southern Oscillation (ENSO) global teleconnection pattern is shifting from the La Niña phase (that has been around for the better part of three years, now) to the El Niño phase, it is difficult to attribute this dryness to ENSO. Historically, ENSO phases have had weaker correlations to temperature and precipitation in the Midwest – particularly[Read More…]
Temperatures warmed into the 80s by the end of Memorial Day weekend, but low dew point temperatures made the heat bearable.