

Over the last 30 days (July 18-August 15), the state average temperature was 73.5◦F, which was essentially normal. Average temperatures ranged from 0.9◦F below normal in northwestern Indiana to 0.5◦F above normal in southern Indiana (Figure 1). The heat was not missing, though, as July 26 through 28 was rather warm across the Midwest. Minimum temperatures ranged from 4 to 9◦F above normal statewide during this period. There were 240 daily high maximum and minimum temperature records broken or tied across the Midwest in late July, with most of Indiana’s broken records occurring as minimum temperatures (Figure 2). August temperatures were near normal until the last few days as cooler temperatures returned to the area. On Monday, August 14, I actually had to break down and buy a sweatshirt (8/14) as I forgot mine at home! Modified Growing Degree Days (MGDDs) have accumulated between 1500 and 2650 units in Indiana, which was near normal (Figure 3). MGDDs have accumulated as expected throughout the growing season.
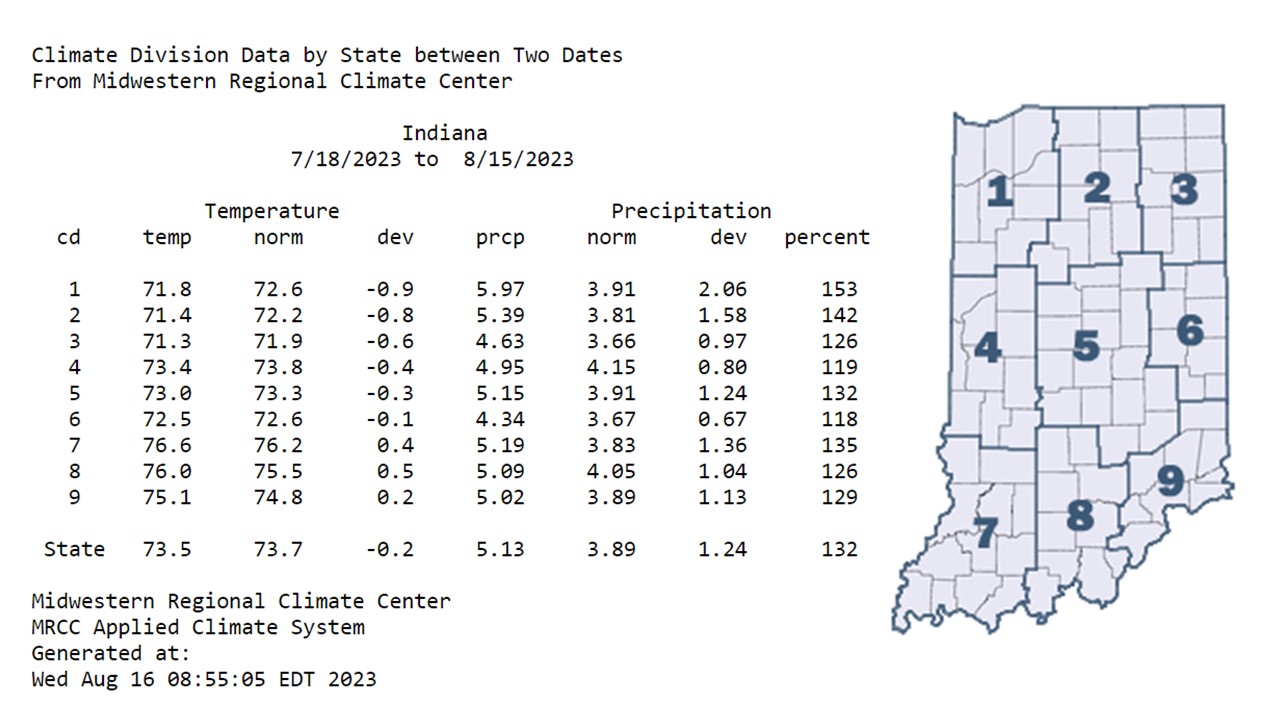
Figure 1: Climate Division data by state, between July 18 and August 15, 2023, which includes observed temperature and precipitation, normal temperature and precipitation, temperature deviation from normal and percent of normal precipitation.
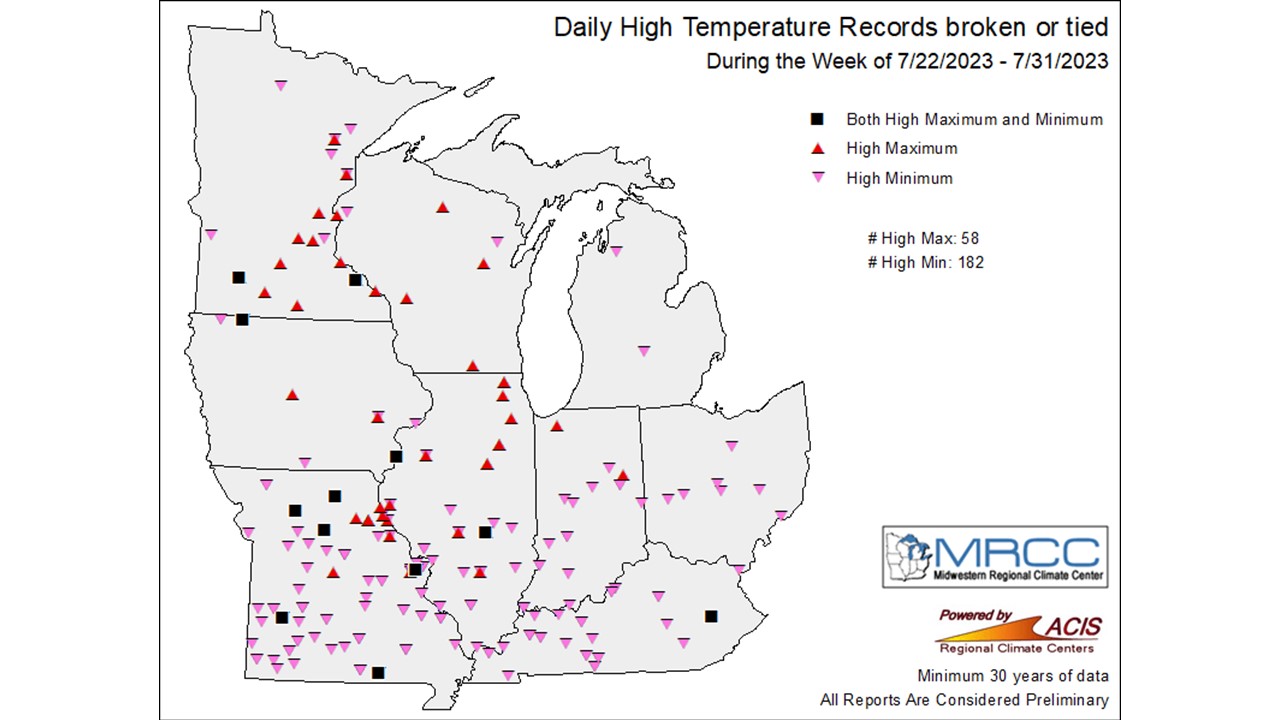
Figure 2: Daily high temperature records that were broken or tied during the last week of July 2023.
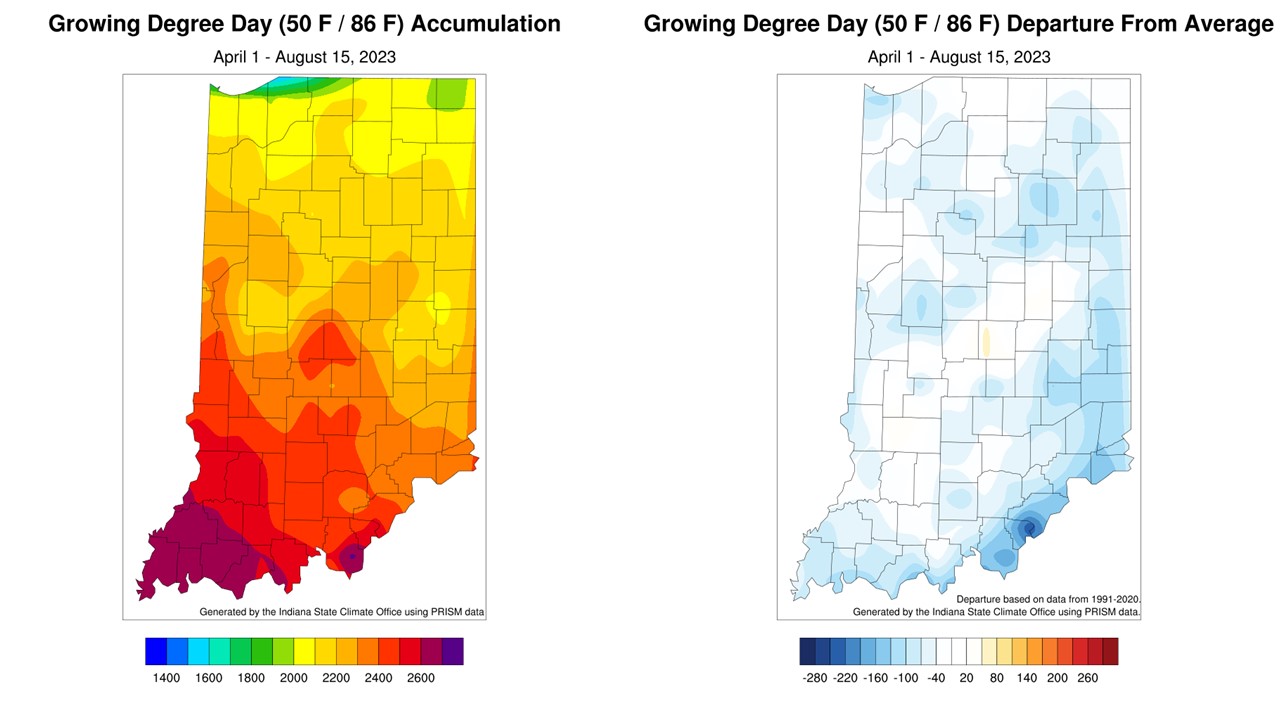
Figure 3: Total Accumulated Indiana Modified Growing Degree Days (MGDDs) April 1-August 15, 2023 (left) and Total Accumulated MGDDs represented as the departure from the 1991-2020 climatological normal (right).
The bigger story, though, has been the return of rain. It seemed at times this year that we could not buy a drop of rain. Since early July, though, we have had several storm systems bring broad precipitation across the state. Over the last 30 days (July 18-August 15), the state averaged 5.13 inches, which was 1.24 inches above normal or 132 percent of normal. Locally higher amounts occurred as strong storms resulted in heavy precipitation totals. Portions of Franklin and Putnam Counties had areas that received 8 to 10 inches of rainfall, which was more than 200 percent of normal (Figure 4). Flooding was observed in Franklin County and tragically resulted in a casualty.
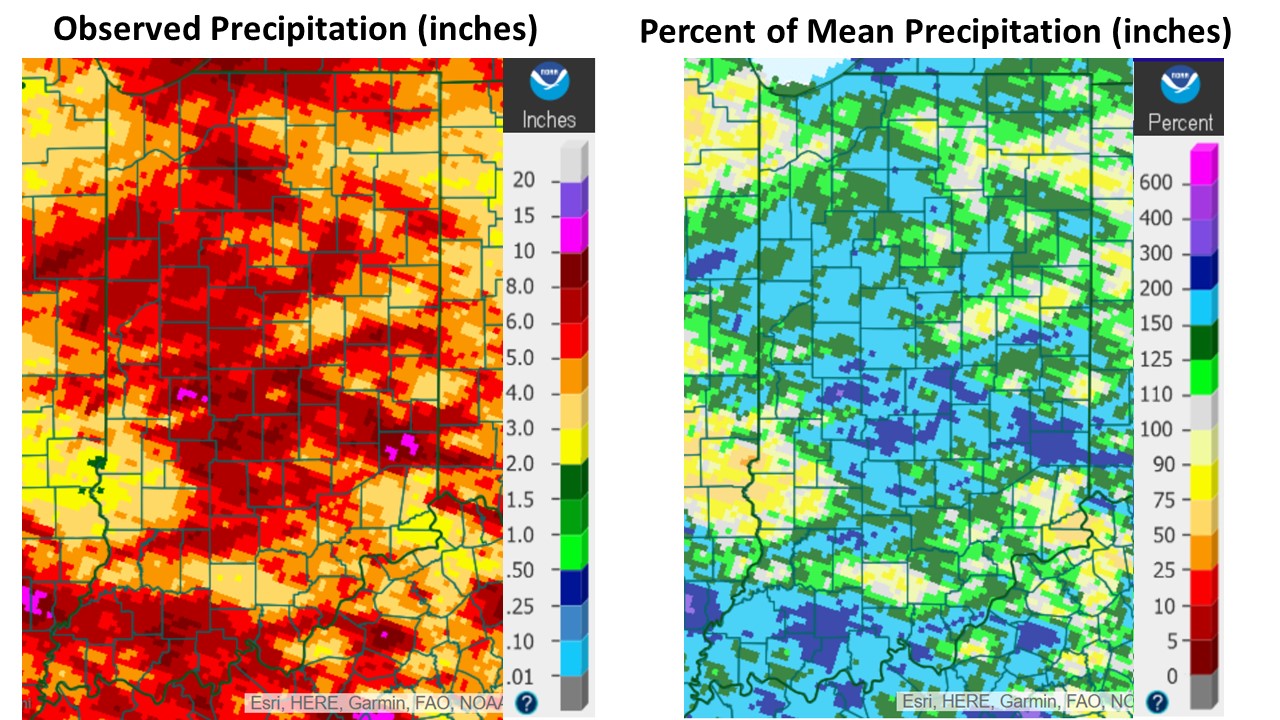
Figure 4: Observed precipitation and percent of mean precipitation for July 18-August 15, 2023 from the Advanced Hydrologic Prediction Service.
Fortunately, Indiana is essentially drought-free with the release of the August 15 US Drought Monitor (Figure 5). Lingering abnormally dry (D0) conditions exist in west-central Indiana, which signals going out of drought and is not technically considered drought. Compared to last week, there was a 6.31% decrease in areas of Indiana in Moderate Drought (D1).
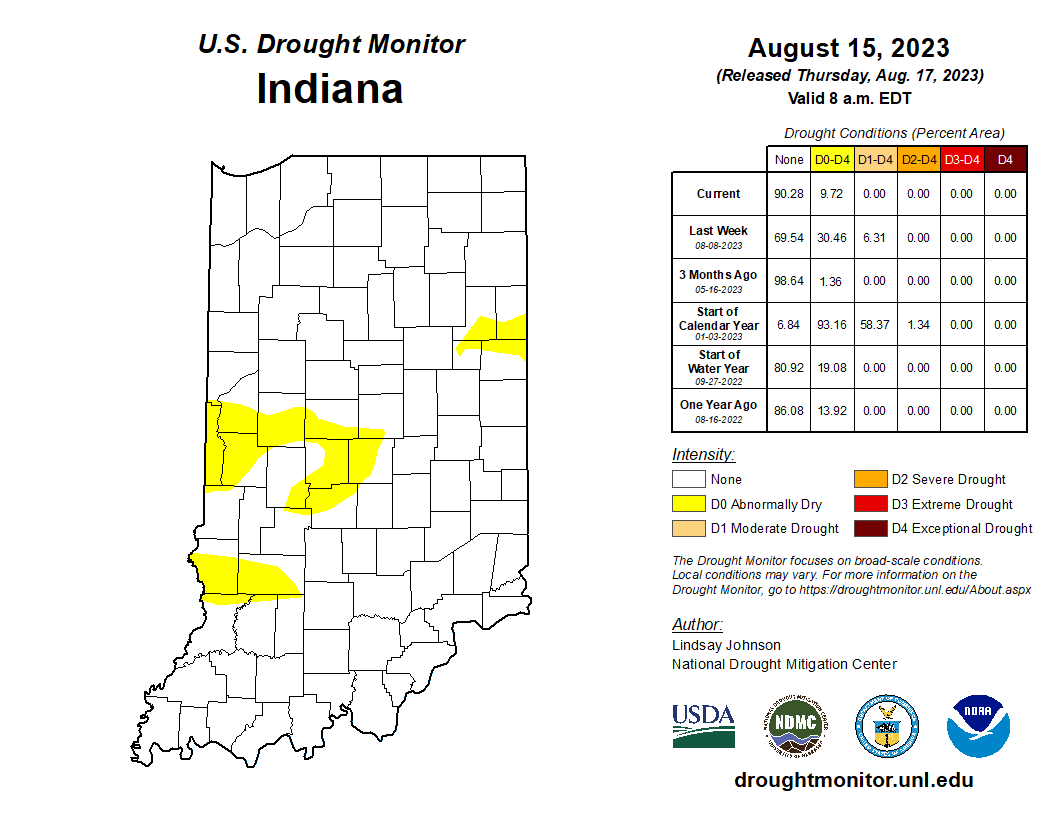
Figure 5: August 15, 2023, US Drought Monitor. The US Drought Monitor is released every Thursday morning by 8:30 AM.
The Climate Prediction Center (CPC) has elevated confidence in above-normal temperatures and below-normal precipitation for the next two weeks (Figure 6). The CPC also has a slight risk for excessive heat next week, as modeled temperatures show heat in the mid to upper 90s (Figure 7). I would not be surprised to see temperatures breaching 100◦F in southern Indiana, which, coupled with the lack of precipitation, may escalate drought concerns by the end of August.
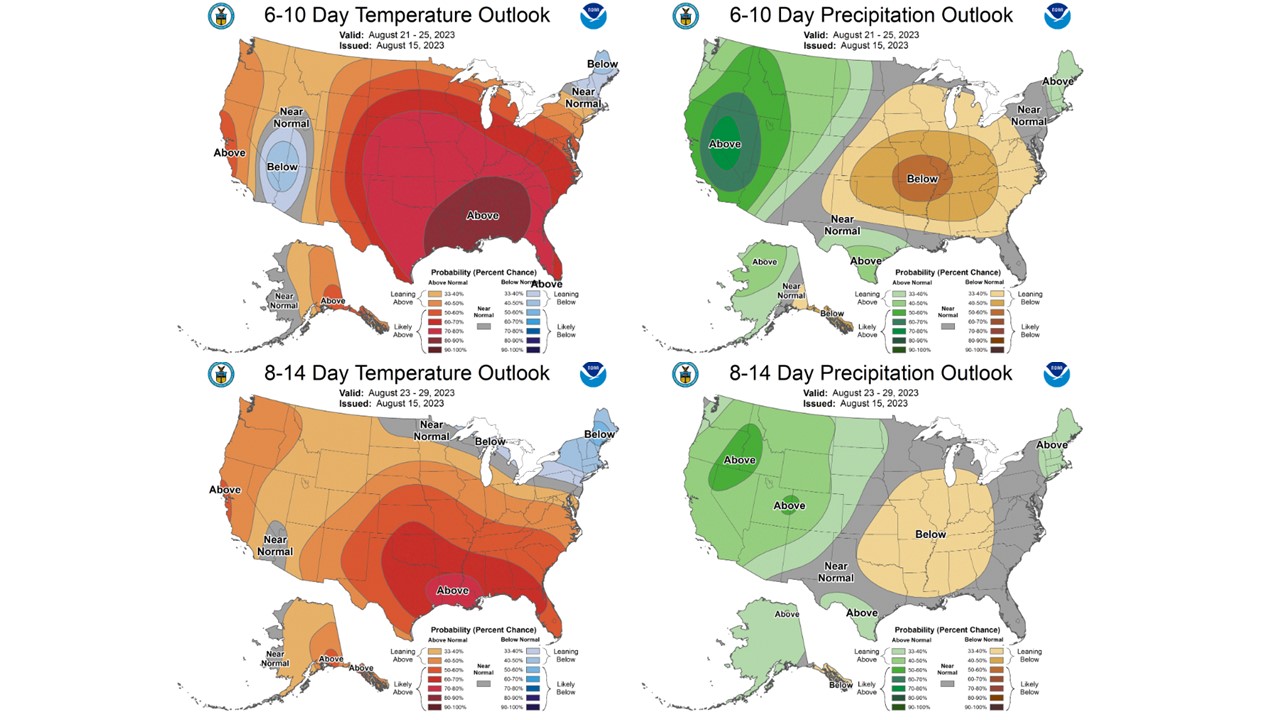
Figure 6: CPC 6-10 day temperature and precipitation outlooks for the United States, valid August 21-25, 2023 (top). CPC 8-14 day temperature and precipitation outlooks for the United States, valid August 23-29, 2023 (bottom).
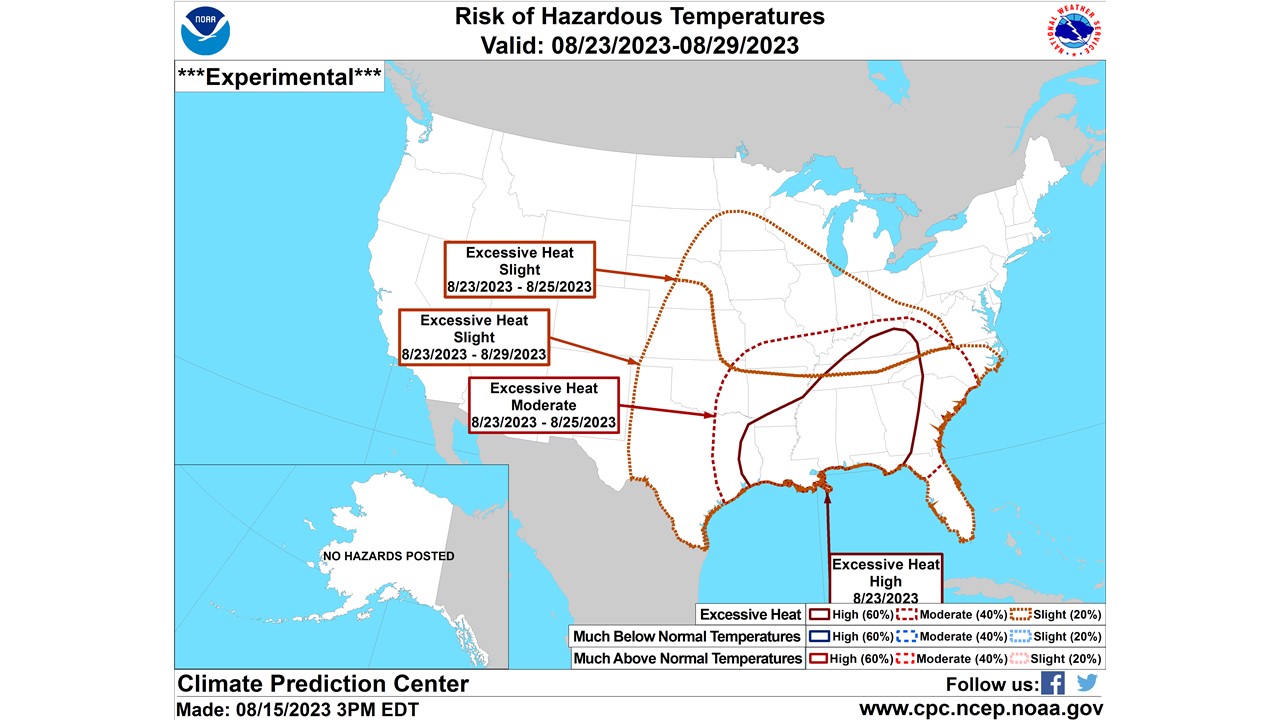
Figure 7: CPC Risk of Hazardous temperatures for August 23-25, 2023.
