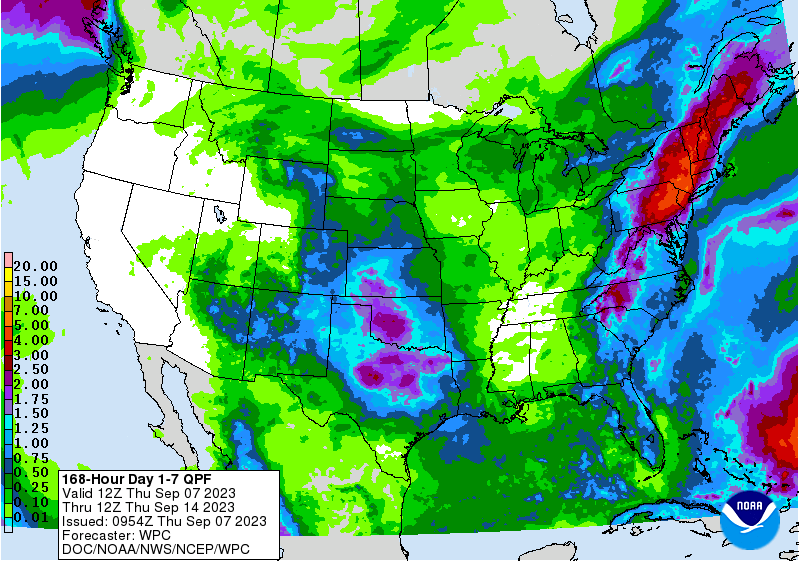
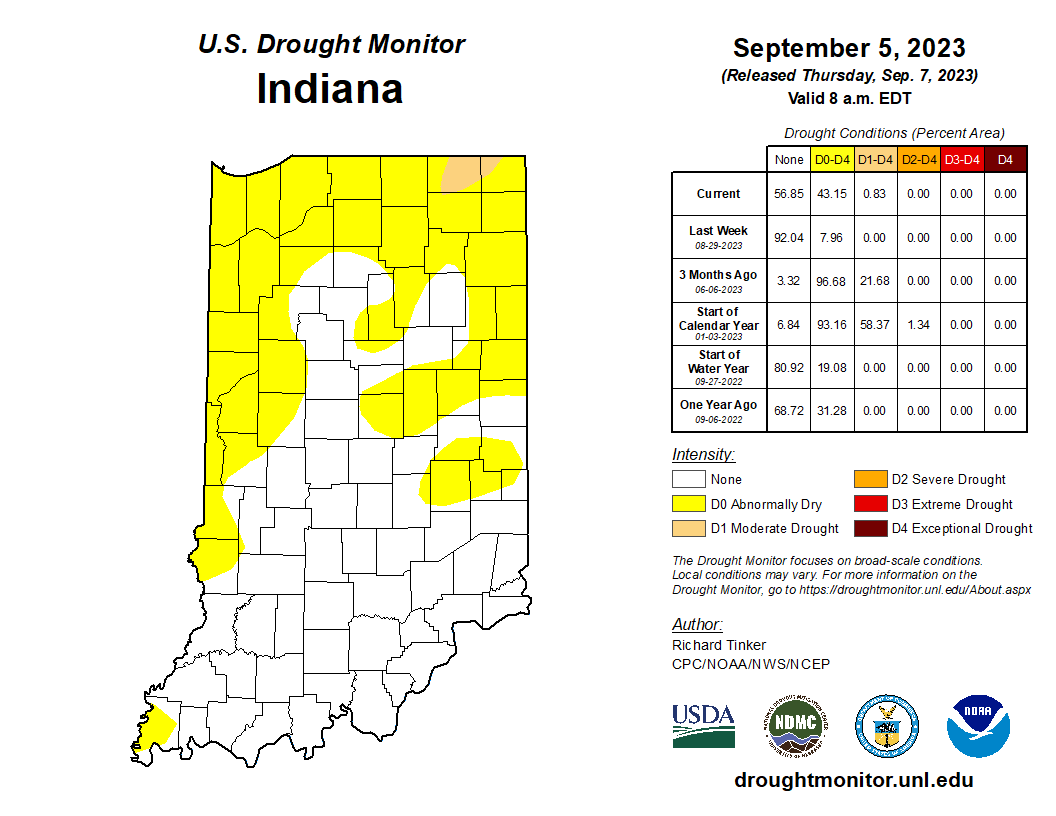
Wednesday, September 6th was the first day in what seemed like a long, long time, that rain fell across most of Indiana. Amounts ranged from a trace to around an inch. Where the rain fell was incredibly spotty (i.e., no rain within a mile or two of significant rain), highlighting the very localized nature of rainfall from these types of events. Even within the same fields or neighborhoods, amounts could vary drastically. Regardless, what did fall was not nearly enough to make up for the loss experienced over the last several weeks, but it was a welcomed reprieve for many. The U.S. Drought Monitor this week was based on data through Tuesday morning, so it did not include precipitation that fell later Tuesday through Wednesday. Therefore, Abnormally Dry (D0) conditions continue to spread inward from the northern, eastern, and western edges of the state (Figure 1). The forecast for the next 7 days indicates low chances for precipitation until Tuesday-Wednesday of next week. Even then amounts are currently forecasted to be less than a quarter of an inch over the entire period (Figure 2). In other words, expect generally dry conditions to continue for a while. Climate outlooks extending out to September 20th are favoring near-normal to slightly below-normal precipitation over that 2-week period with drier-than-normal conditions more likely near the end of that period.

Figure 2. Seven-day total precipitation forecasted for the period from September 7-14, 2023. The small amount forecasted for Indiana is likely to fall around September 12-13.
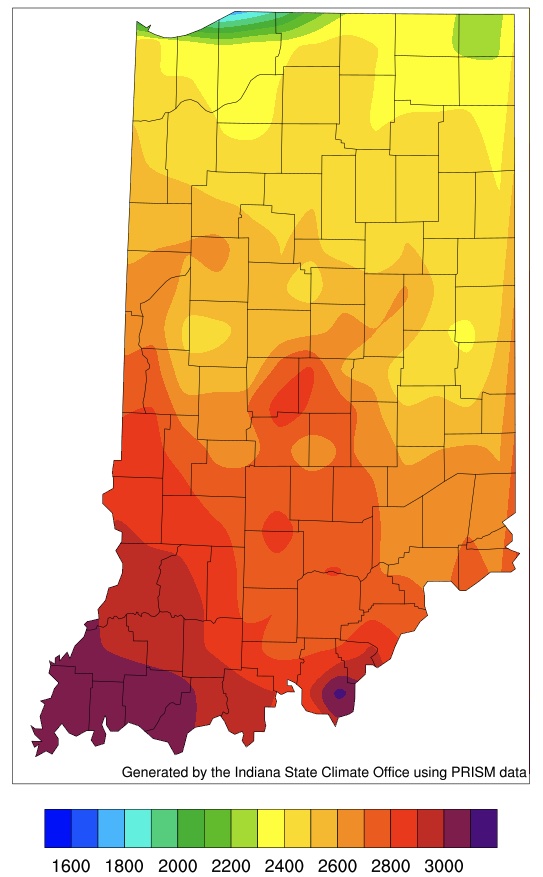
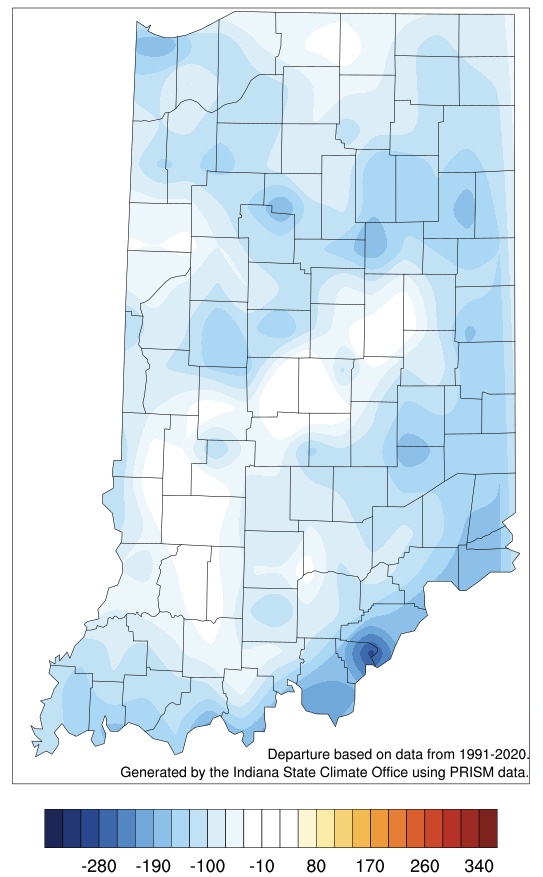
With the passage of the precipitation events from the middle of this past week, cooler temperatures from our north have moved in and are anticipated to stick around over the next several weeks. It is still much too soon to be worrying about the potential for freeze events, but hopefully conditions will start to feel more like fall. As the temperatures gradually decline towards our winter lows, accumulated modified growing degree-day accumulations are starting to slow down. Since April 15th, Indiana has accumulated between 2300 (northern counties) to over 3100 (southern counties) units (Figure 3). Across the state, these values are slightly below the climatological average for this time of year (Figure 4).


