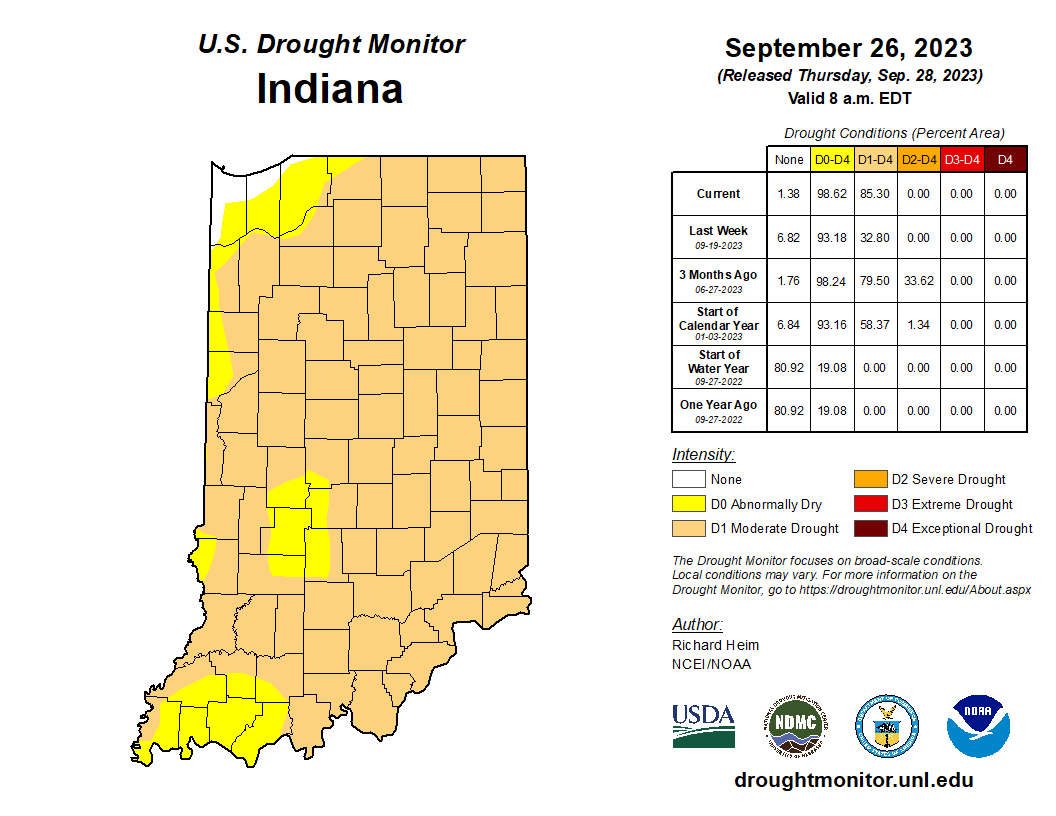
To say the last few months have been dry is a bit of an understatement. Since August 1st, only a sliver of Newton and Benton counties (northwest Indiana) and the tiniest speck of Warrick County (southwest Indiana) have had above-normal precipitation. Most of western Indiana has been near (but below) normal, while the rest of the state has seen less than 75% of normal amounts (Figure 1). Normal amounts are approximately the 30-year average from 1991-2020. Since September 1st, the story gets even drier (Figure 2). It is rather shocking to see most of the state has received less than 25% of the normal amount of precipitation typical during that period. This has led to most of Indiana now being classified in Moderate Drought (D1) according to the U.S. Drought Monitor (Figure 3). How long is this expected to go on? The 7-day forecast has most all of Indiana dry (except for northeast Indiana that might get a very small amount). Fortunately, this dry pattern then move out of the area within the next 6-10 day, with near normal to above normal precipitation patterns following. In fact, the national Climate Prediction Center is slightly favoring above-normal precipitation for October. This is not very strong confidence, but certainly better than the dry pattern seen lately! Unfortunately, the various climate outlook models that offer these probabilities were all over the place for the 3-month period of October-November-December, providing no precipitation guidance over this longer period. This is likely due to it being a transition season (from summer to winter) but also with a strong El Niño pattern moving in. El Niños and La Niñas tend to have weaker climate correlations in the Midwest than other parts of the U.S. and the fall season tends to be the most difficult season for those global oceanic patterns to predict any strong guidance. Climate scientists are still waiting a bit longer to get a better understanding of how strong this winter’s El Niño will be before predicting what this upcoming winter may be like.
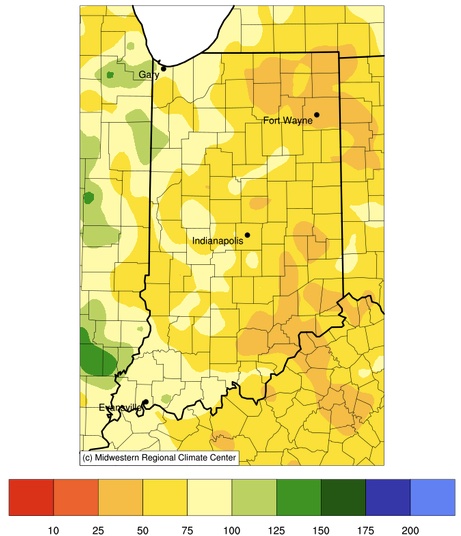
Figure 1. Precipitation represented as percent of normal based upon the 1991-2020 period for August 1 through September 28.
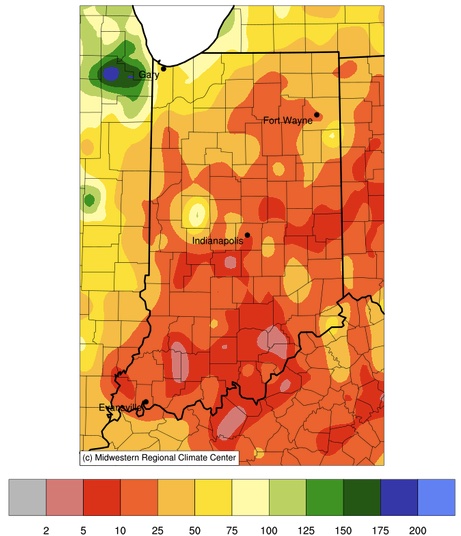
Figure 2. Precipitation represented as percent of normal based upon the 1991-2020 period for September 1 through September 28.
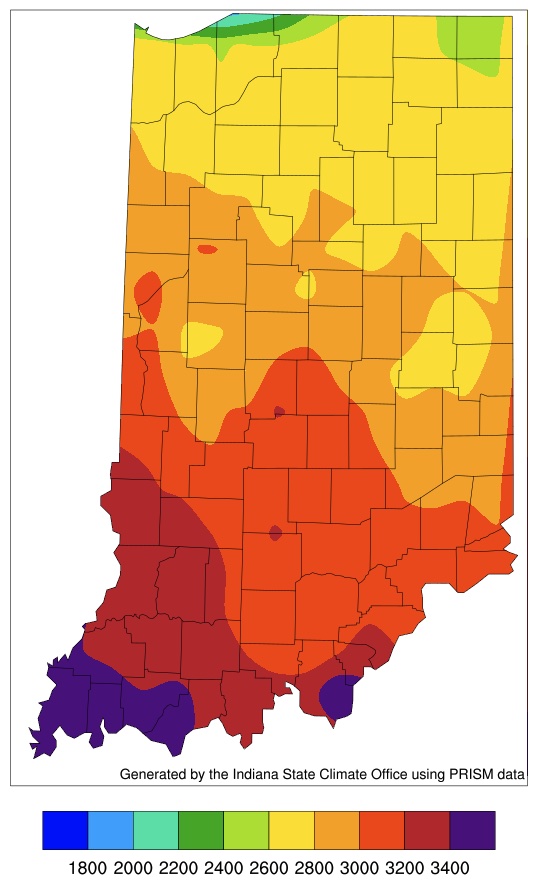
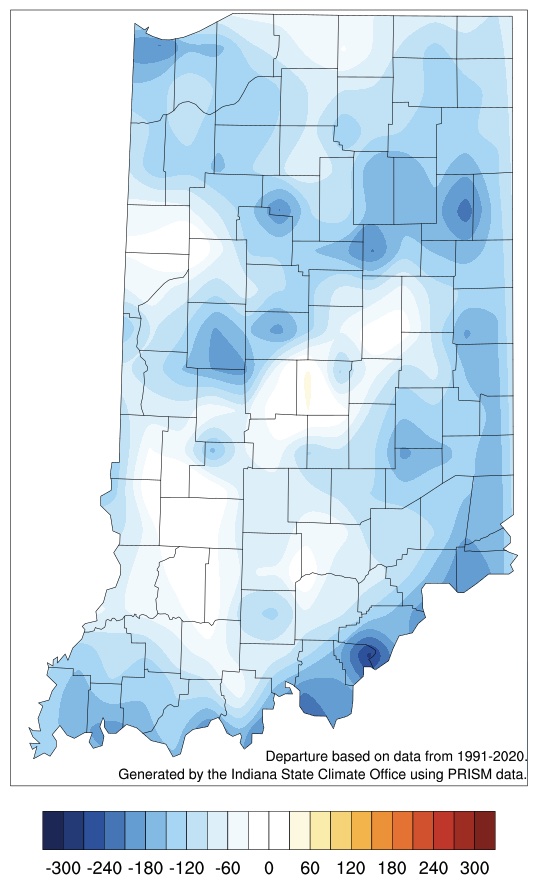
While the dry pattern will start shifting away from the region, there are strong probabilities that above-normal temperatures will move in over the next 2 weeks. This should not mean triple-digit heat waves, but may make us wonder what happened to the start of autumn. Do not worry. Those fall colors are already developing. We may have to keep enjoying them without a coat on for a while, though! Accumulated modified growing degree-day temperatures since April 15th now range from around 2600 units (northern Indiana) to over 3400 units (southern Indiana) (Figure 4). Most of Indiana has accumulated less modified growing degree days compared to the 1991-2020 period by up to 175 units (Figure 5).


