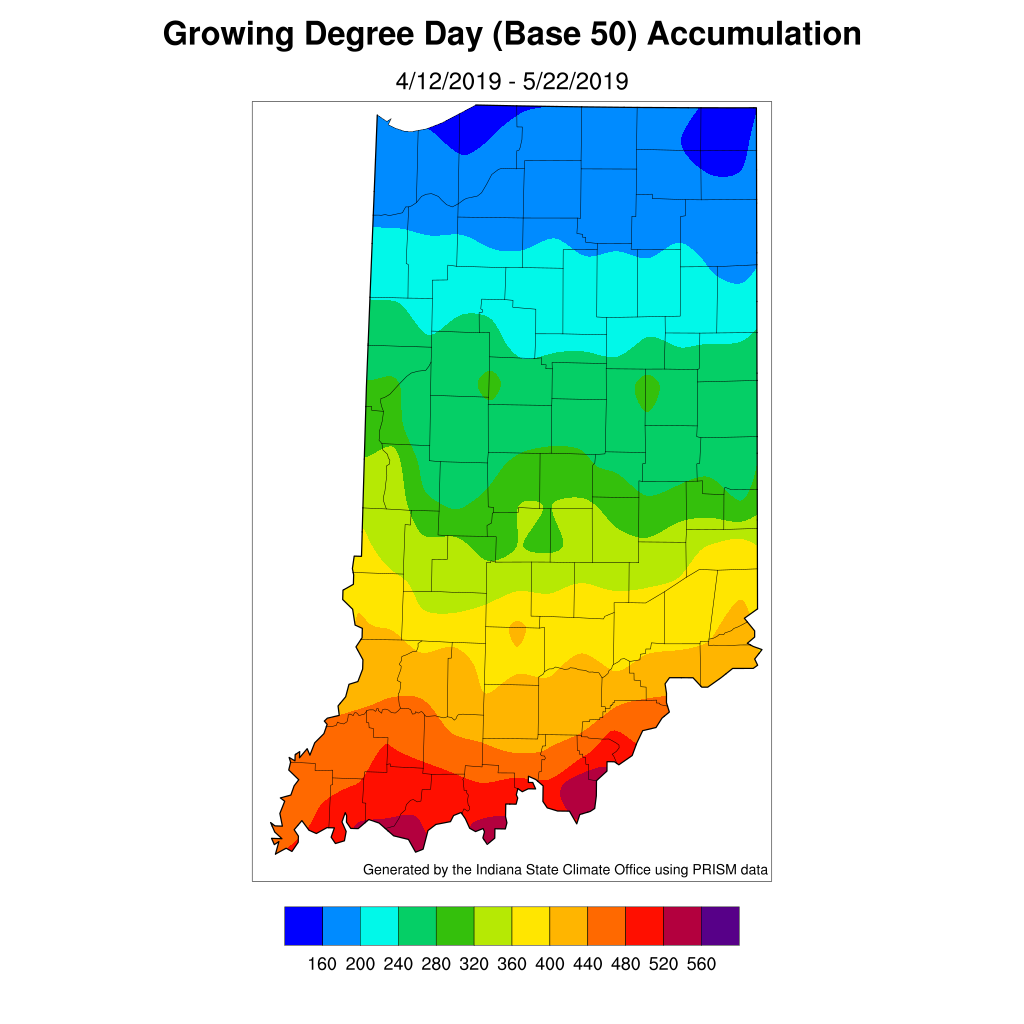
The following map, based on GDD50, is provided to assist in timely scouting of emerged cornfields for black cutworm damage.

The following map, based on GDD50, is provided to assist in timely scouting of emerged cornfields for black cutworm damage.
To facilitate speedy planting between rain showers many growers are skipping starter fertilizer. What might be the consequences?
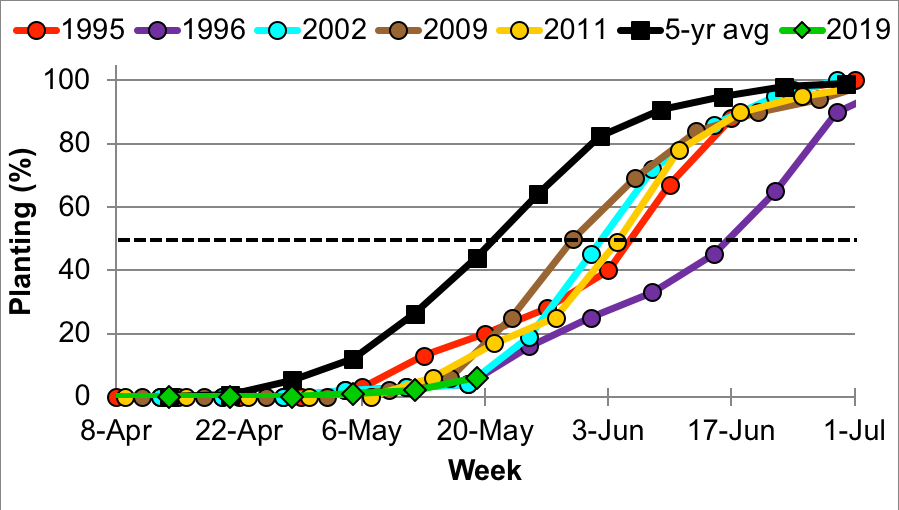
Soybean planting progress (or the lack there of) for Indiana and much of the Midwest is one of the slowest on record. Indiana soybeans normally reach 50% planted by May 20th, but we are only at 6% by the same period.
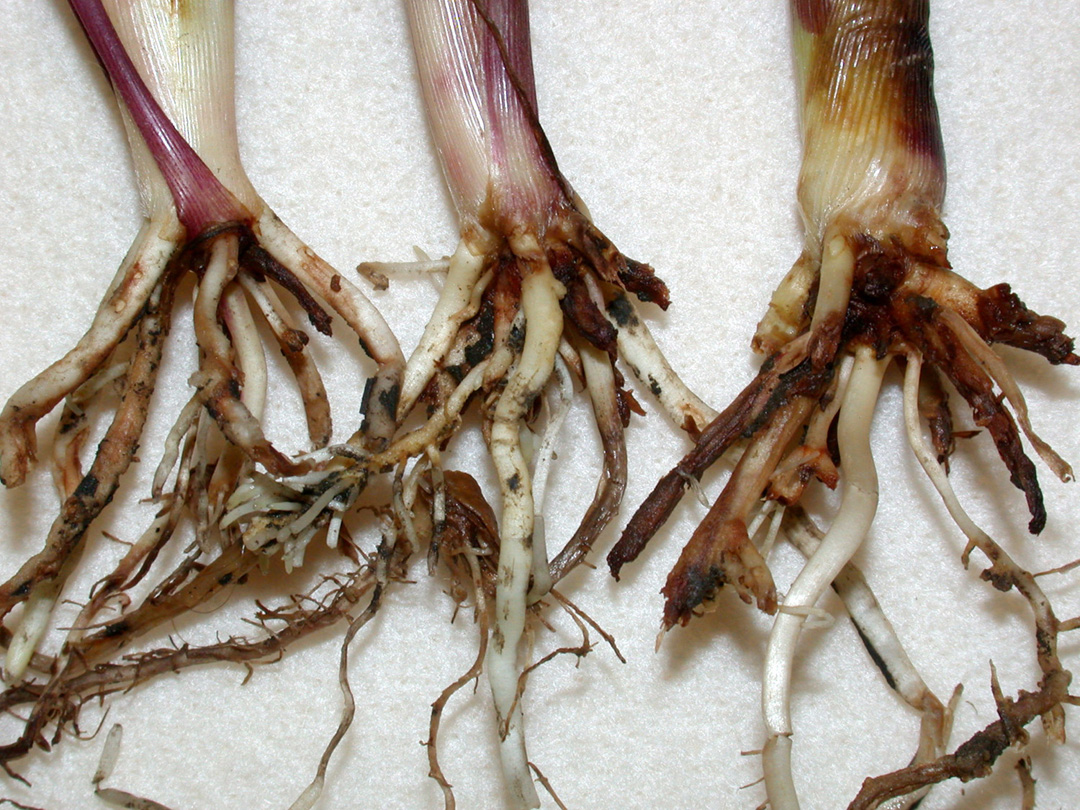
Desperate times calls for desperate measures. As delayed planting conditions persist and the calendar approaches June, we can’t anticipate all likely miscues that will play out in the next few weeks.
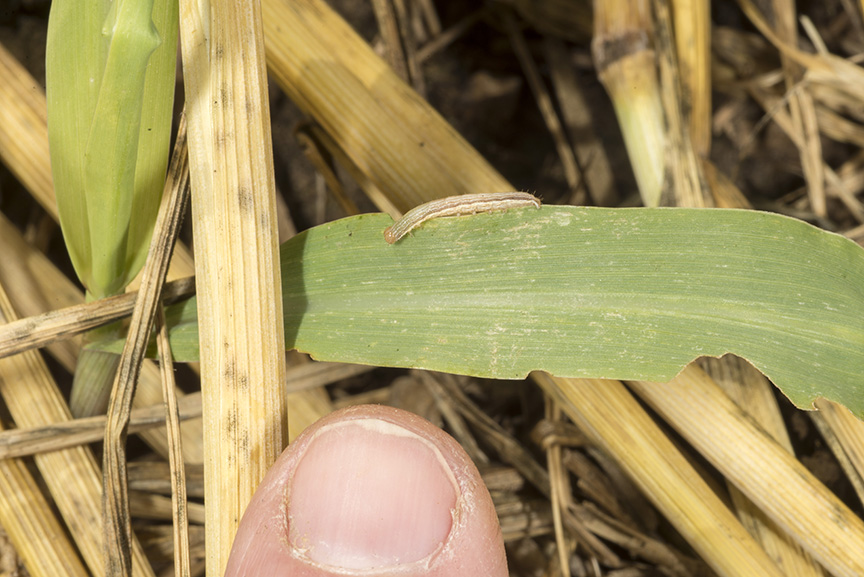
Armyworm moth captures have varied throughout the state, with some being quite impressive this spring (see “Armyworm Pheromone Trap Report”).
Armyworm Pheromone Trap Report – 2019

The number of 30-, 40-, and 60-ft wide (or larger) field crop planters across the U.S. Midwest is greater today than, say, twenty years ago. Certainly, individual farmers can plant more acres of corn and soybean per day with today’s large field equipment than they could twenty years ago.
Being able to predict when a field of corn will reach particular leaf stages can be useful for scheduling post-emergence applications of certain herbicides and sidedress N fertilizer, especially if your farming operation is so large that regular field inspections are difficult to work into your busy schedule.

We keep getting this question, because as we write this, it is storming yet again in many locations in the Midwest. Rain, rain, and more rain has pushed back timely planting everywhere.
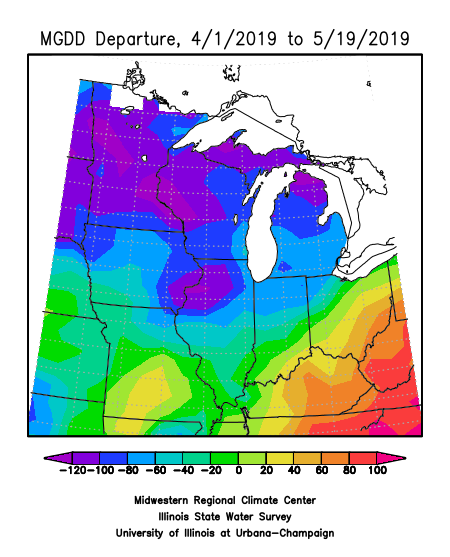
So far for the month of May, temperatures across the state vary by nearly 2˚F above normal in the southeast and almost 3˚F below normal in the extreme northwest. Similarly, the same trends can be seen in the Modified Growing Degree Days as they are based on temperature (Fig 1). The main story continues to be the precipitation for most of the state. Since January 1, precipitation is between 3 to 9 inches above normal in spots. Adding observed near normal to slightly above normal precipitation for the month in some areas is really delaying folks in the agriculture industry (Fig 2). Looking at the short term outlook from the Climate Prediction Center (Fig 3 & 4), much of the state has above normal chances for seeing above normal temperatures and precipitation over the 6 to 10 day and 8 to 14 day outlooks. Our active weather pattern doesn’t[Read More…]
© 2026 Purdue University | An equal access/equal opportunity university | Copyright Complaints | Maintained by Pest&Crop newsletter
If you have trouble accessing this page because of a disability, please contact Pest&Crop newsletter at luck@purdue.edu.