

Rainfall over the past few weeks has helped to improve drought conditions across much of Indiana. Northeastern and southwestern Indiana have benefited the most, removing previous Abnormally Dry or Moderate Drought status from the U.S. Drought Monitor (USDM; Figure 1). Unfortunately, west-central Indiana and near the greater Cincinnati area have been missing out from most of these rain events, keeping these areas in low USDM categories for the time being.
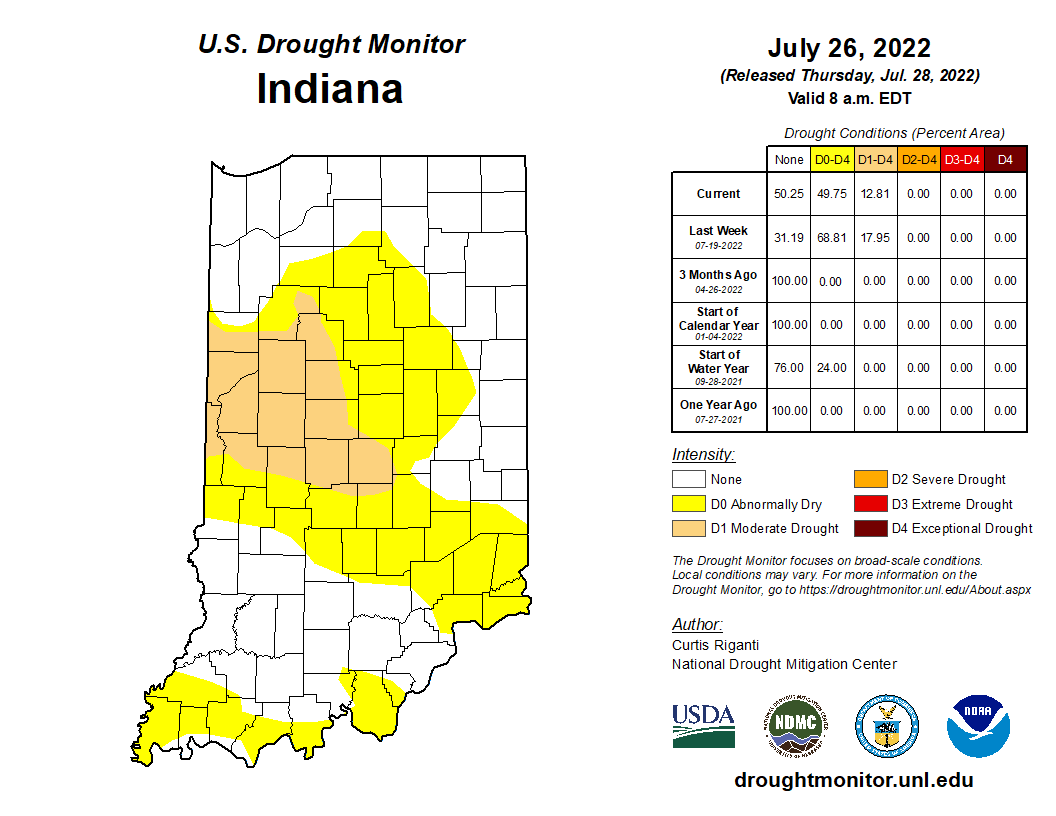
Figure 1. U.S. Drought Monitor for Indiana as of July 26, 2022.
High temperatures continue as summer progresses. Comparing this summer with average conditions over the past 30 years indicates that temperatures (both maximum and minimum) have been within a few degrees of normal. However, conditions have often felt much hotter, so what is going on? First, the higher humidity have made conditions (both day and night) feel hotter than usual. As mentioned in previous articles, higher humidity prevents plants and animals from naturally cooling through evaporation and transpiration. These higher humidity levels are likely attributed to higher temperatures. Even though most days are only a few degrees above normal, each degree increases the atmosphere’s capacity to have more water vapor in suspension. Indiana has also experienced pulses of extreme heat throughout the season that have been offset by cooler-than-normal periods. When averaged over time, this mathematically indicates that temperatures across several weeks or months have been near normal, while masking those extreme hot periods. The Midwestern Regional Climate Center’s (mrcc.purdue.edu) Corn Heat Stress Degree Day (SDD) tool shows how southern Indiana, in particular, has accumulated more SDDs than normal (Figure 2). Derived in a similar manner to growing degree days, this SDD model uses 86°F as a threshold with the assumption that most corn plants shut down when exposed to these extreme temperatures.

Figure 2. Modified corn heat stress degree day accumulation departures from normal for January 1 through July 25, 2022. https://mrcc.purdue.edu/VIP/indexSDD.html
Climate outlooks for the next 6-to-14 days, the month of August, and the 3-month period of August-September-October are all favoring above-normal temperatures and below-normal precipitation (e.g., Figure 3). While this may sound like bad news, remember that impacts often are more related to the timing and rate of precipitation rather than the comparison of total amounts over longer (e.g., weeks and months) periods of time. This past spring, precipitation was typically below normal. However, rain fell every few days. While those total amounts over a 4-week period may have been below normal, they still kept the soil wet and limited field days. There is currently too little guidance about the timing and rates of precipitation when looking out beyond a week.
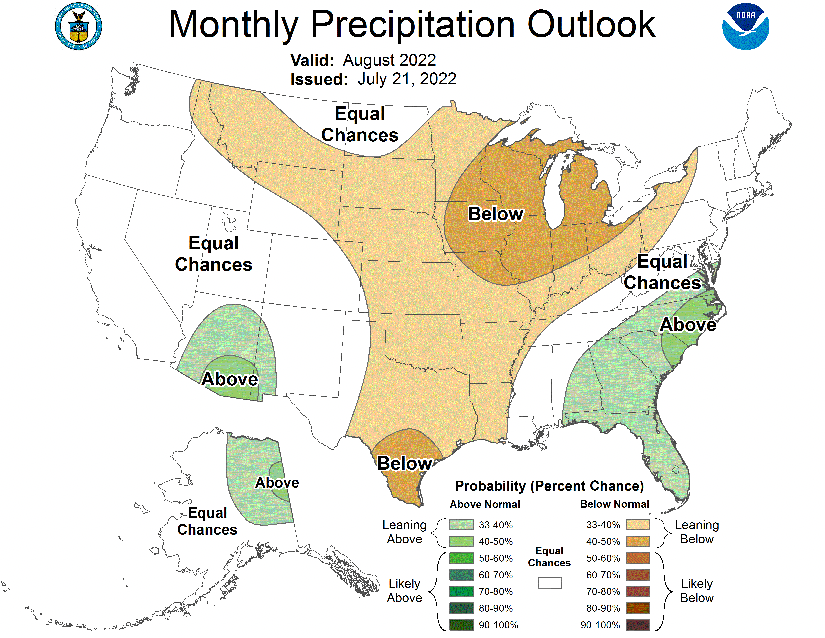
Figure 3. Climate outlook for August from the national Climate Prediction Center. Levels of shading indicate levels of confidence for above- or below-normal conditions to occur.
Figures 4 and 5 show the modified growing degree accumulations and departures from normal, respectively, for April 15 through July 27, 2022.
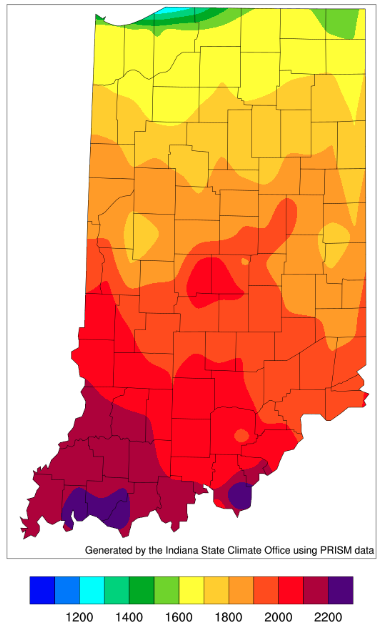
Figure 4. Modified growing degree day (50°F / 86°F) accumulation from April 15-July 27, 2022.
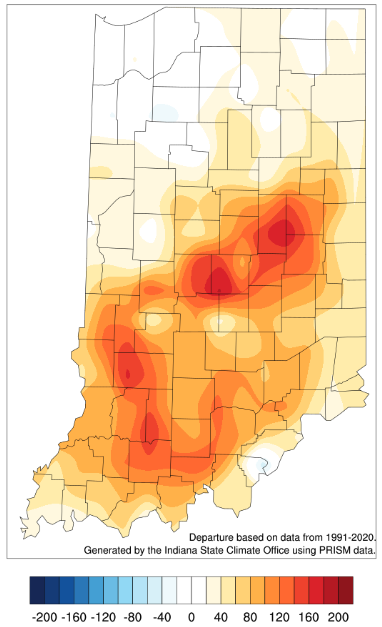
Figure 5. Modified growing degree day (50°F / 86°F) accumulation from April 15-July 27, 2022, represented as the departure from the 1991-2020 climatological average.
