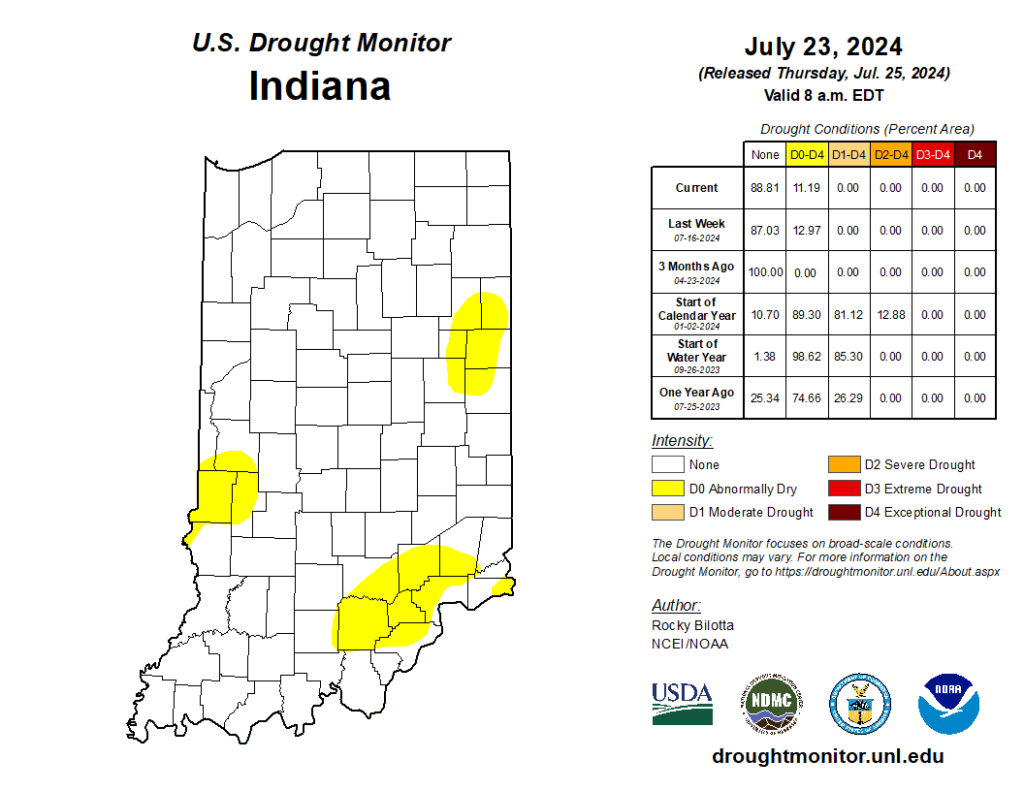
Several weeks ago, Indiana received enough rain to eliminate drought across the state, leaving behind just a few counties in Abnormally Dry (D0) status. Fortunately, this week has been relatively quiet, allowing many areas to alleviate flooding issues. The U.S. Drought Monitor kept those Abnormally Dry areas nearly the same this week (Figure 1), so how might things change? Will this recent dry period re-introduce Moderate Drought (D1) and/or expand those Abnormally Dry areas? Or will more rain keep Indiana in a more normal situation where precipitation passes through every few days, separated by typical Midwest hot and humid conditions?
First, it is important to review what has been happening across our state. Over the past two weeks, Figure 2 shows that most of Indiana has receive above-normal precipitation except for southeastern and southern Indiana. However, even those locations are within one inch of normal amounts (based on the 1991-2020 period). Temperatures during this period were near to below normal which likely slowed down evapotranspiration rates. The combination of both factors has led to good levels of volumetric soil moisture within the first 20 inches of depth for most locations.
While this past week has been mostly dry (up to one inch below-normal precipitation), the 7-day forecast is predicting around an inch of rain spread over several days from the end of this upcoming weekend into early next week. This can be ideal since this distribution over several days would suggest minimal runoff with significant opportunity for the water to be absorbed by the environment. Climate outlooks over the next 6-14 days (July 30 – August 7), however, are strongly favoring above-normal temperatures with a slight chance of above-normal precipitation during the earlier half of that period. The latter half of that period is favoring near-normal precipitation amounts. Therefore, it is reasonable to expect relatively high evapotranspiration rates with little chance of excessive precipitation. This may lead to a water deficit and will need to be closely monitored.


