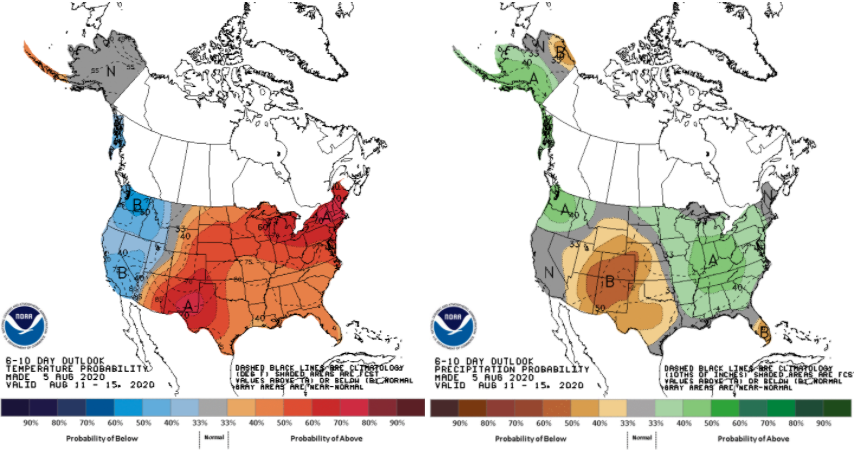
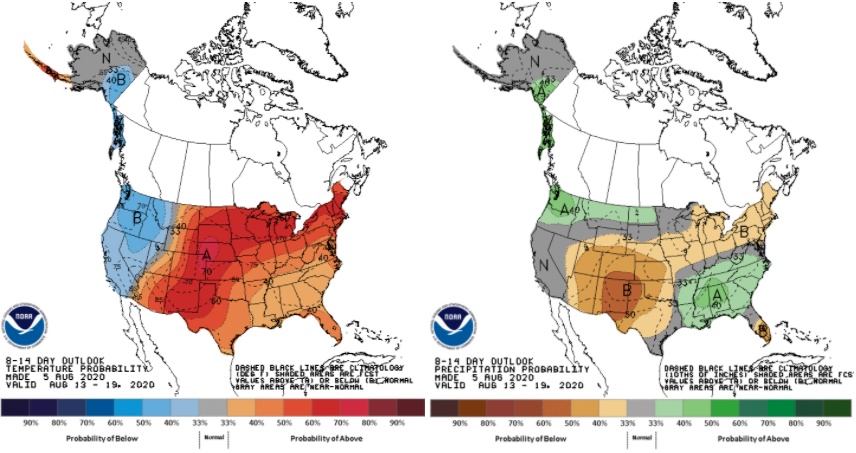
The climate outlooks issued by the national Climate Prediction Center are keeping things exciting for those trying to plan ahead. The 6-10-day (Figure 1) and 8-14-day (Figure 2) outlooks that approximately represent August 11-20 are showing significant confidence for above-normal temperatures across Indiana. Precipitation is more of a mixed bag where August 11-15 is likely to experience above-normal precipitation, but August 16-19 is likely to have below-normal precipitation. The experimental three-to-four-week outlooks continues to show confidence for above-normal temperature, but there is too much uncertainty about precipitation to lean wetter or drier. Seaming all of these sub-monthly outlooks together would imply that August is likely to be warmer than normal and precipitation will present itself through a variety of wet and dry periods. Seems fairly typical. Is this guidance at all useful? One would expect August to be warm and precipitation to come and go. The good news is the probabilistic information being provided is not indicating a month of hot, dry conditions that could exacerbate a drought. Nor is it calling for cool, wet conditions when crops could use all the growing degree-day accumulations to thrive. Therefore, while these climate outlooks appear a bit too predictable, remember that they could have been worse!

Figure 1. Probabilistic climate outlooks for temperature (left) and precipitation (right) for the period of August 11-15. Source: Climate Prediction Center.

Figure 2. Probabilistic climate outlooks for temperature (left) and precipitation (right) for the period of August 13-19. Source: Climate Prediction Center.
Indiana was starting to dry out near the end of June into early July, causing the US Drought Monitor to gradual expand the region of “Abnormally Dry [D1]” and even introduce “Moderate Drought [D2]” across the state. However, by the end of July, a series of weather systems combined with convective (“pop-up”) rain showers helped to replenish most of the moisture deficits and reduce the percentage of the state in dry conditions. Currently, the only parts of Indiana that seem to be lacking some good rainfall are the northeast counties. Perhaps those uncertain climate outlooks will favor this area!
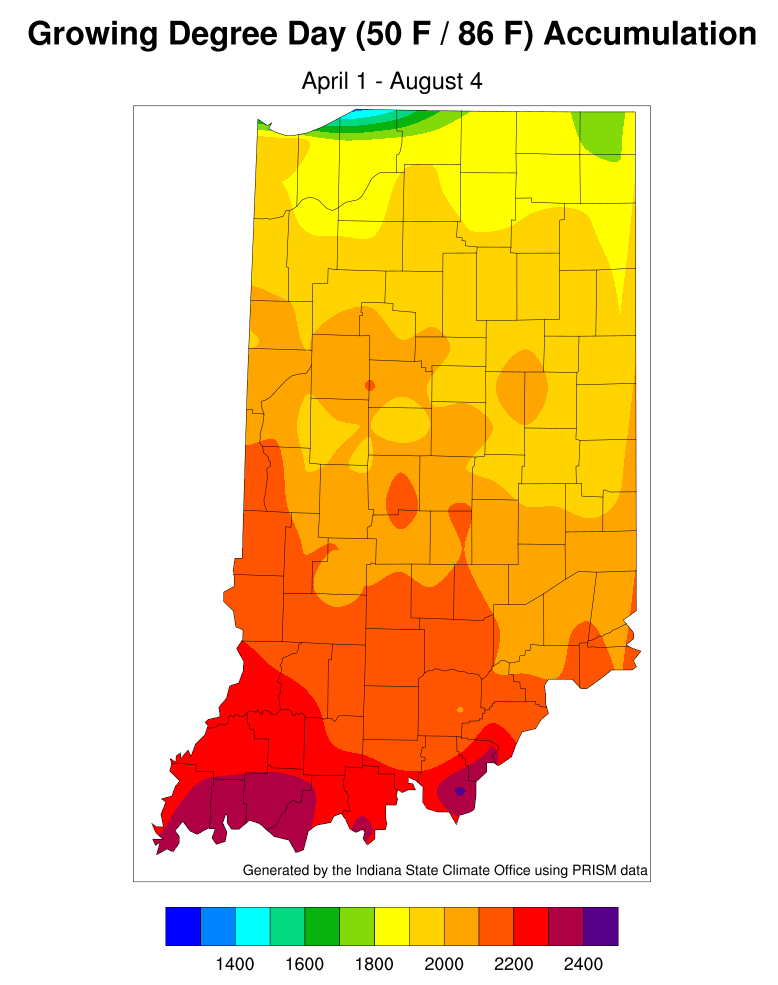
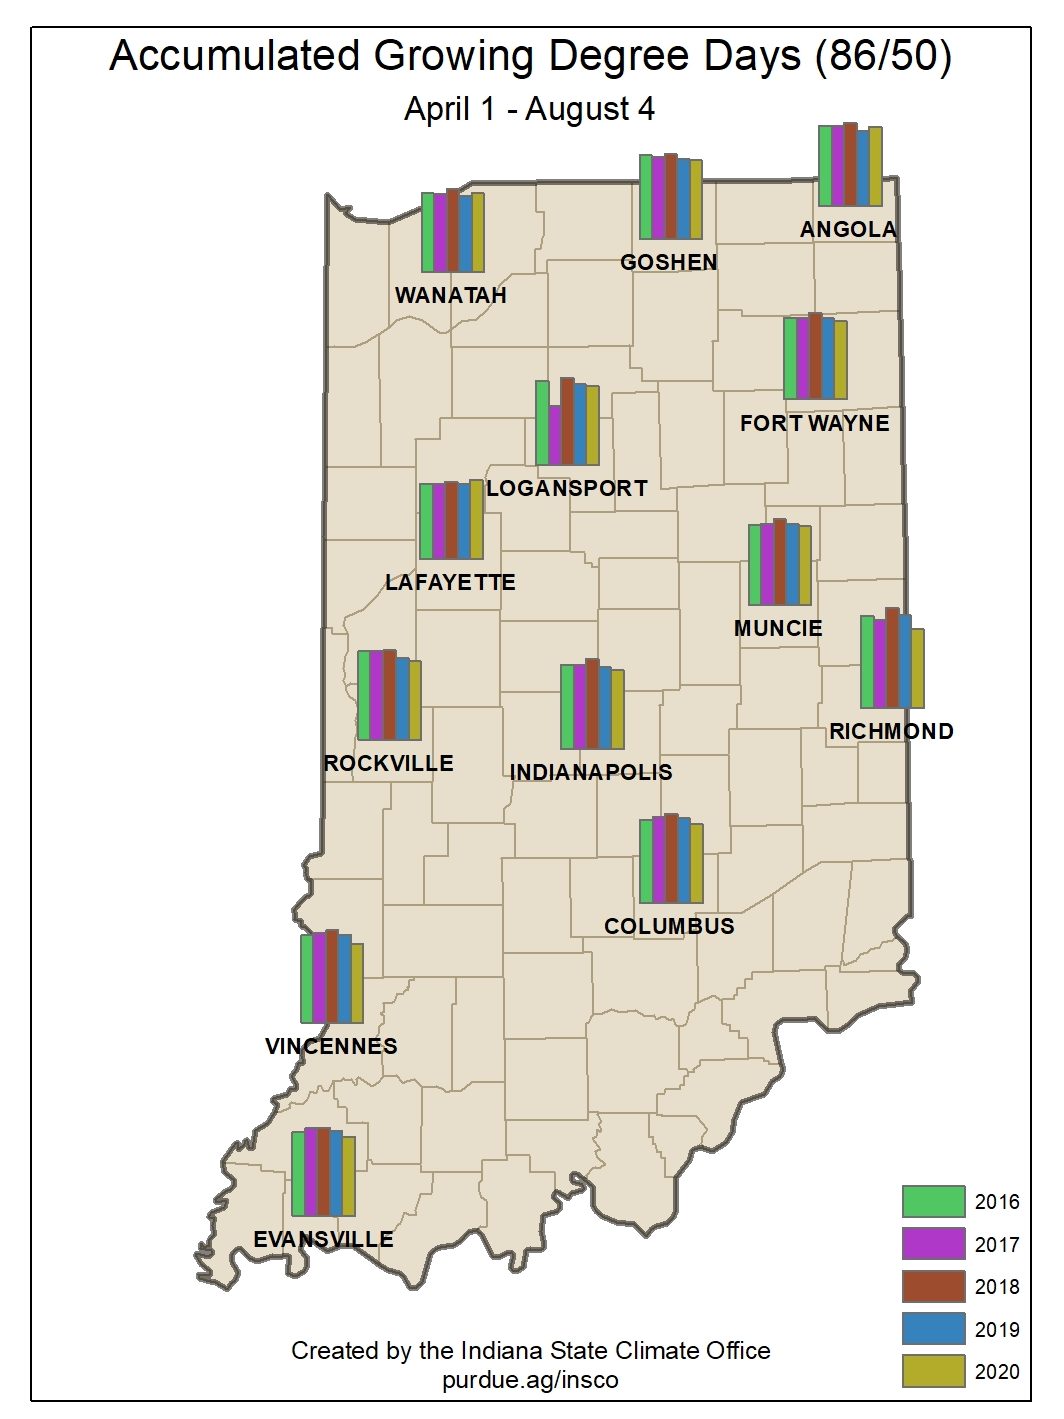
Accumulated modified growing degree-day units continue to increase with the warm season. Figures 3 and 4 show the accumulations since April 15 along with the accumulated comparisons to past years.


