

Staying true to global climate trends these days, March 2020 finished warmer and wetter than the 1981-2010 climate normal period. Snowfall across the state was below normal and flooding was a common feature across the state. Remarkably, there were 3 to 5 more rainy days than average across Indiana in March. This has led to saturated soils throughout the state and a desperate need for some drying out. Modified growing degree days (50/86)* have begun to accumulate, and seem to be relatively comparable to 2019 accumulations (Figures 1 and 2).
Will this excess rainfall and above average number of rainy days continue to happen? What about these warmer temperatures? The national Climate Prediction Center is currently sending mixed messages. The April monthly outlook suggests increased confidence in temperatures being warmer than average and slight confidence that precipitation will be above normal. However, shorter-range outlooks (i.e., 8-14 day and 3-4 week) are suggesting even greater confidence for cooler temperatures throughout the rest of the month. At this time, it does not look as if April 2020 will be as wet as April 2019. However, delayed planting may be necessary due to wet and cool conditions so keep an eye out for those dry periods to get condition monitoring and planting in when you can!
To keep track of recent frost/freeze data and explore climatological probabilities of frost/freeze events still occurring, check out the Midwestern Regional Climate Center’s Vegetation Impact Program’s Frost Freeze Guidance products. This suite of tools can show the date of the most recent freeze event (32°F and 28°F), how many days since the last freeze event (can be an indicator of early growth and green-up), how many frost/freeze days have occurred over the past 14 days and a variety of freeze climatologies.
*Modified growing degree days are similar to growing degree days but use cutoff temperature thresholds of 50°F (minimum temperature) and 86°F (maximum temperature). So, if the minimum temperature was 42°F and the maximum temperature was 90°F, then instead of averaging those 2 values and subtracting 50, the minimum and maximum threshold temperatures would be averaged (e.g., (50 + 86) / 2) and then subtract 50. This is used to account for vegetative growth response to temperature extremes.
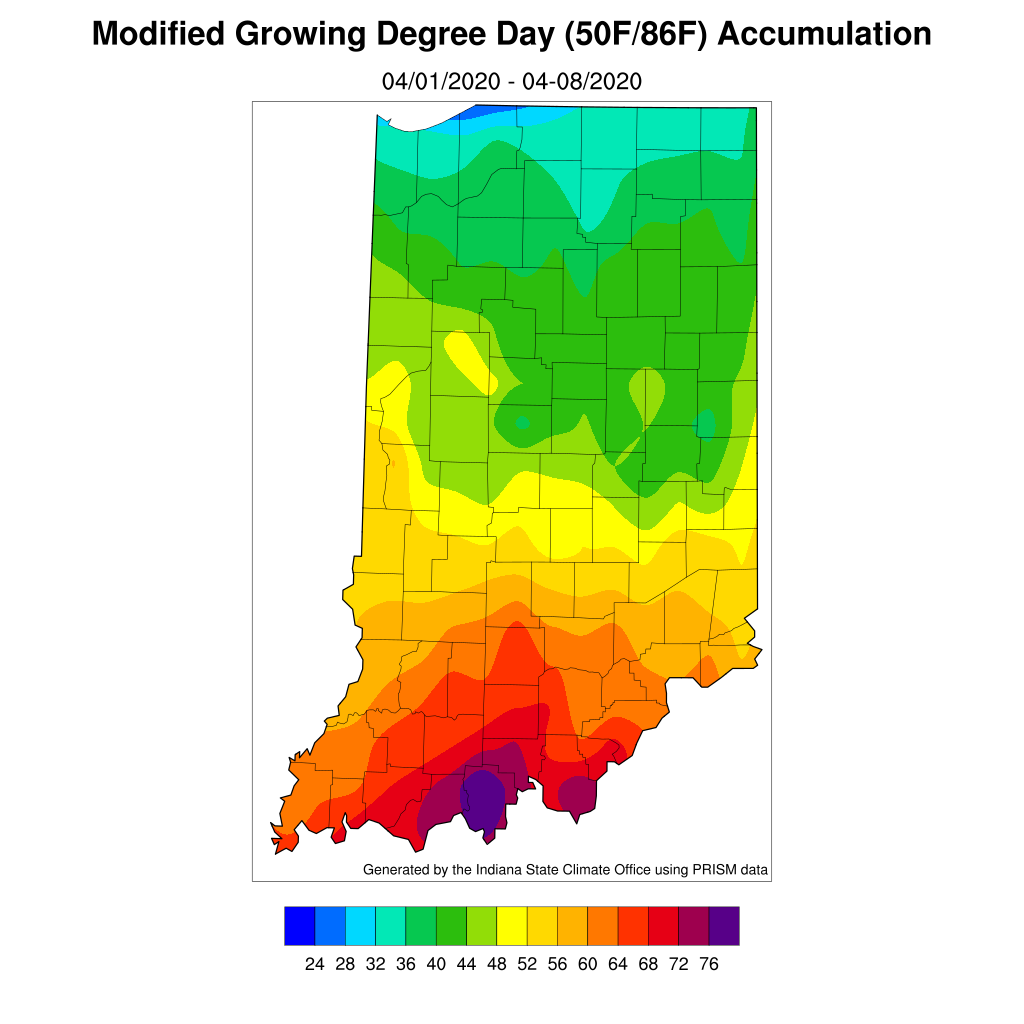
Figure 1. Accumulated modified growing degree days since April 1 through April 8 using minimum temperature threshold of 50°F and a maximum threshold of 86°F.
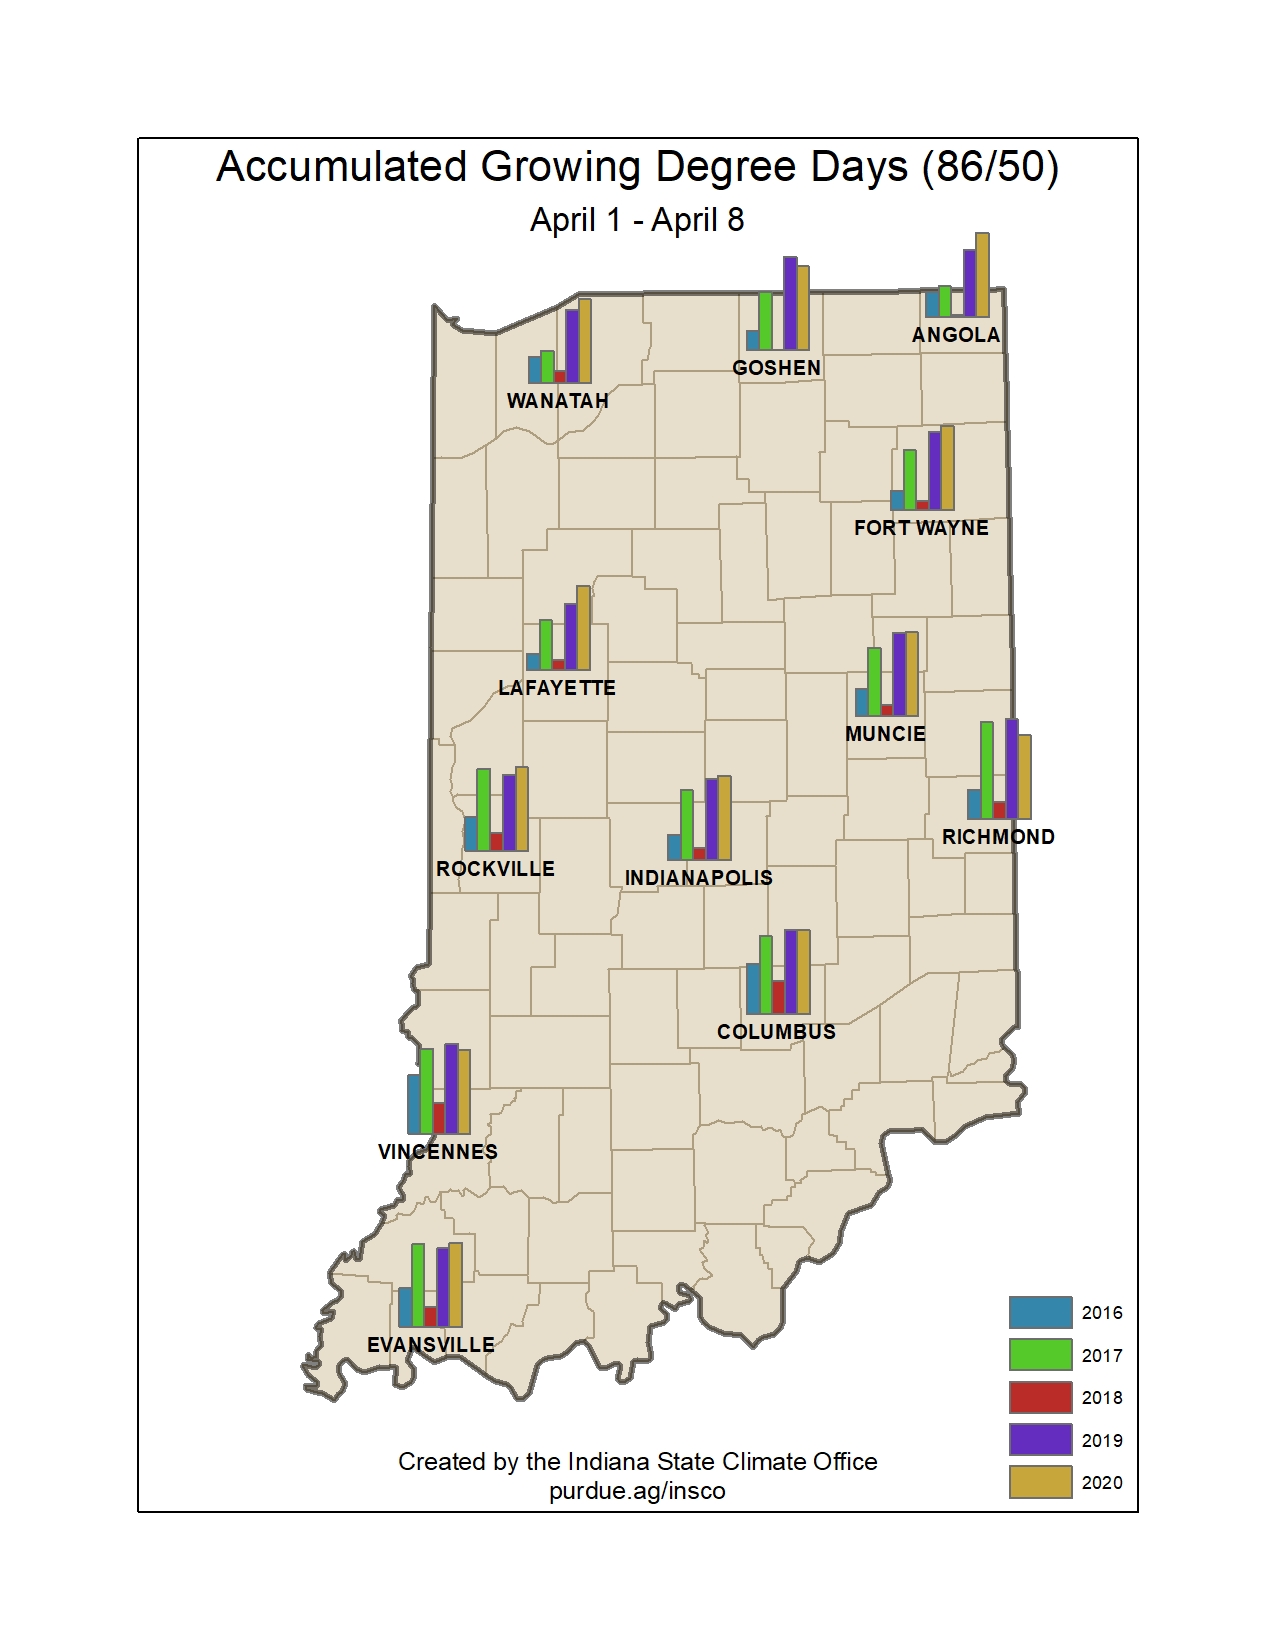
Figure 2. Comparison of accumulated modified growing degree days (50/86) for April 1-8 for 2016 through 2020.
