

Precipitation and storm tracks this year seem to be stagnating in patterns that have caused some parts of Indiana to feel as if they are drowning and other parts to feel like they are in a drought. Indiana is not a particularly large state, so it is impressive to see the extremes across such a short area. Sometimes, these extremes can be explained from just one or two storm events that pass through, but recently it seems to be a series of events that set up this polarized pattern of precipitation winners and losers. Figure 1 shows the 30-day accumulated precipitation presented as the percent of mean climatology for Indiana from July 21 to August 19. Central Indiana has been experiencing dry conditions with some locations only have received 25%-50% of what they would normally receive during that time period. In contrast, northeastern and southwestern Indiana have experienced a surplus with her neighboring states (Michigan and Illinois) receiving even more precipitation (Figure 2). This has brought a return of abnormally dry conditions to the state the last several weeks with the likelihood of expansion unless widespread precipitation occurs (Figure 3). Unfortunately, the climate outlooks for the rest of August are favoring normal to below-normal precipitation.
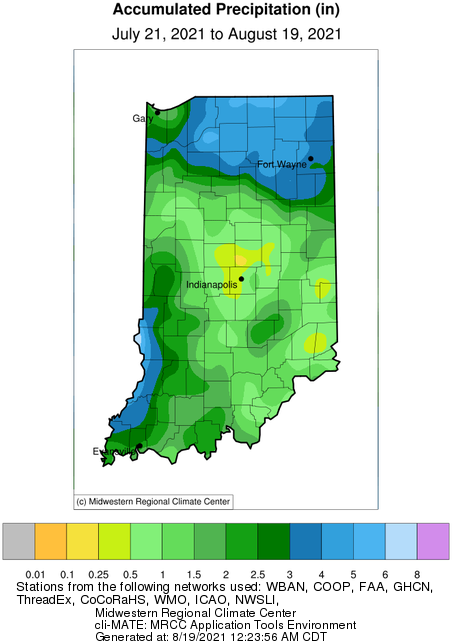
Figure 1. Accumulated precipitation from July 21 through August 19, 2021.
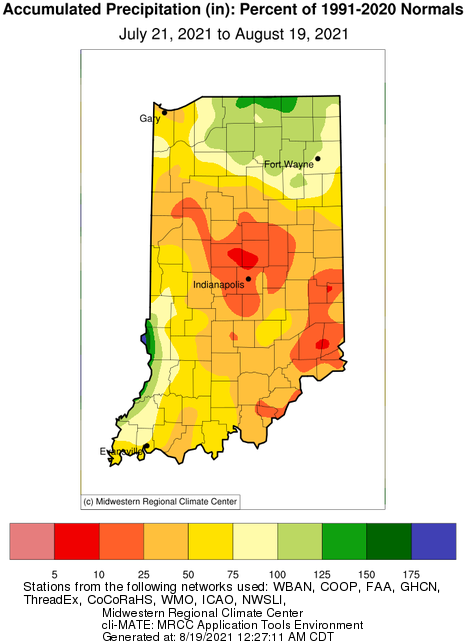
Figure 2. Accumulated precipitation from July 21 through August 19, 2021 represented as a percent of the normal climatology for that time period.

Figure 3. US Drought Monitor status based on conditions through August 17, 2021.
Extreme heat was the theme last week where maximum heat indexes exceeded 100°F at multiple locations across the state. The highest heat indexes were recorded at Huntingburg Airport (108°F) and Shelbyville Municipal Airport (107°F). While above-normal temperatures are expected to continue over the next few weeks, dew point temperatures (an indicator of how humid the air is) should be low enough to minimize the risk of those dangerously high heat index values returning. However, this does not mean heat-related stress or injury is not possible to warrant continued vigilance of potential risks.
Growing degree-day accumulations have now reached slightly over 2100 units in northern Indiana to around 2700 units in southern Indiana (Figure 4). Overall, these accumulations are slightly behind the 30-year average from 1991-2020 in the southern part of the state and near normal throughout the rest of Indiana. When compared to the most recent years (Figure 5), that difference shows more specific areas and their relative departures.

Figure 4. Modified growing degree day accumulations from April 1 to August 18, 2021.
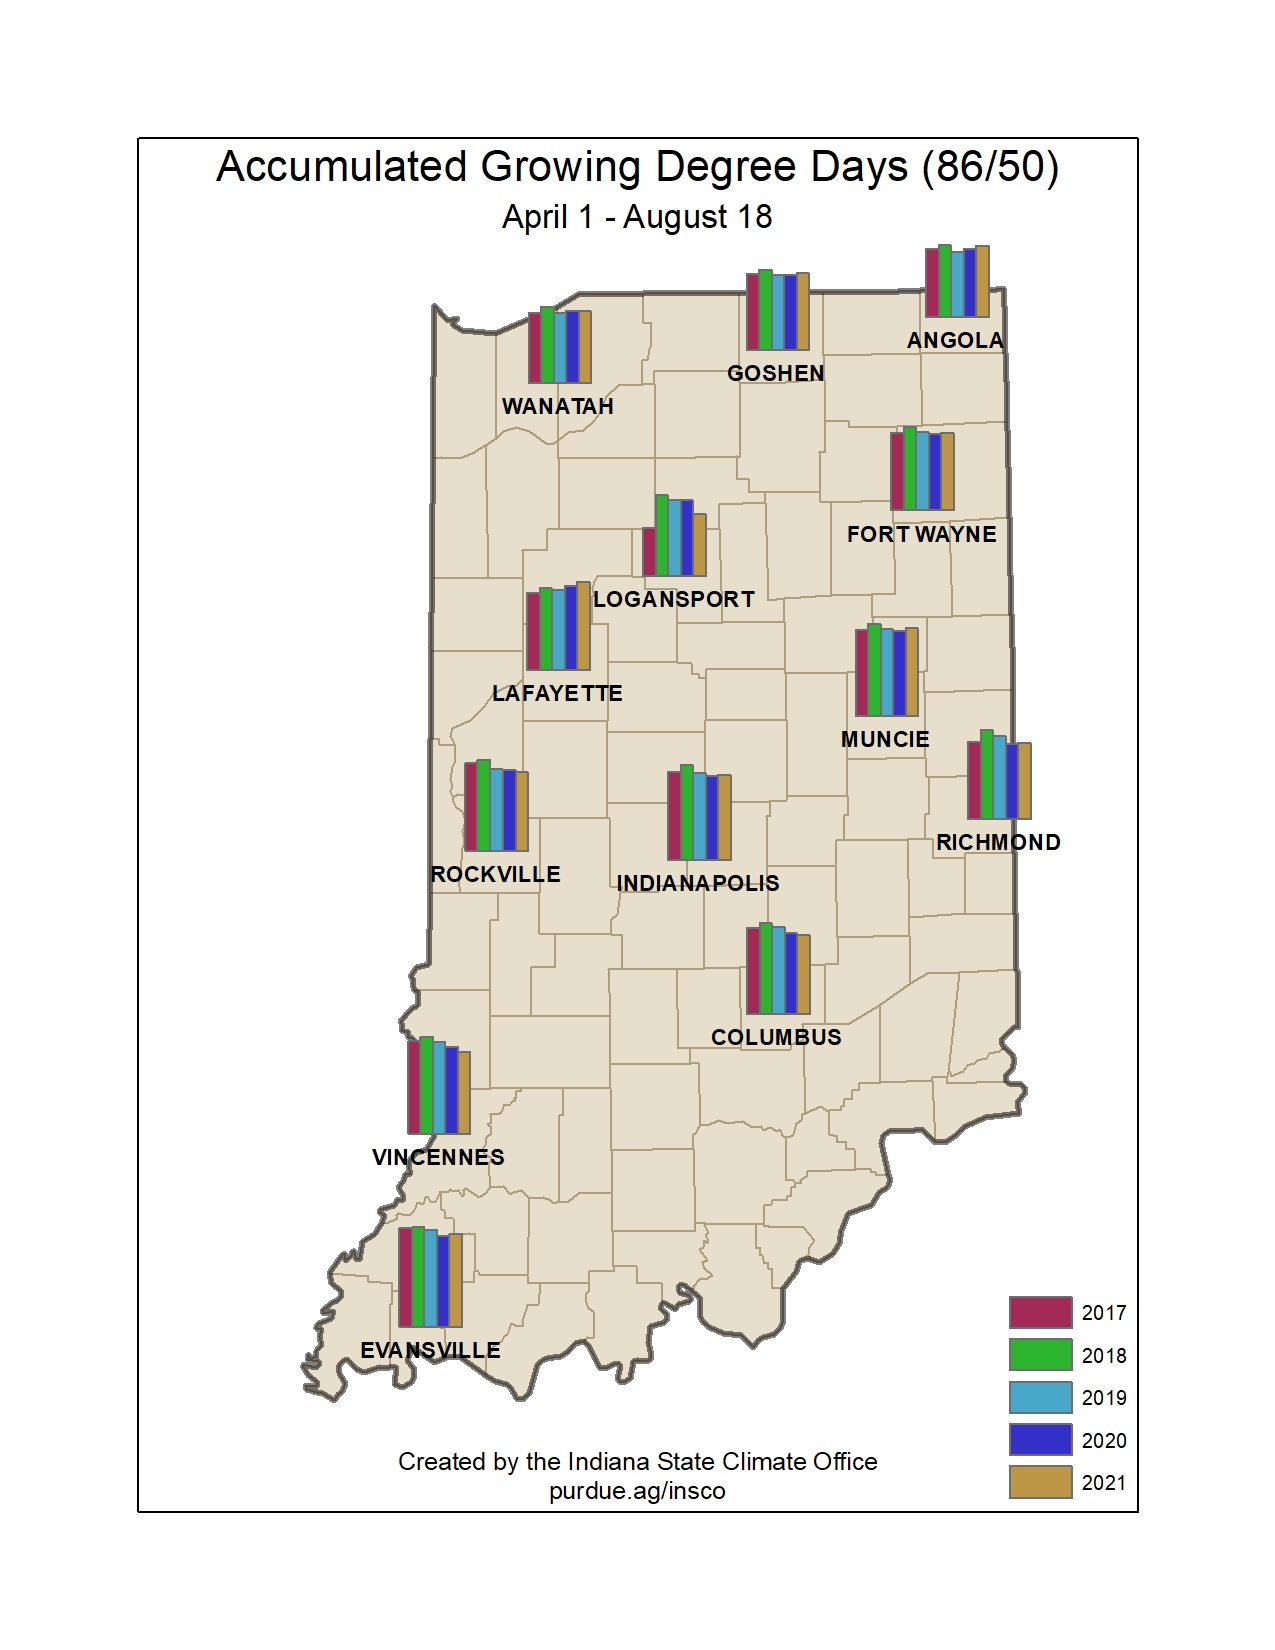
Figure 5. Comparison of 2021 modified growing degree day accumulations from April 1 – August 18 to the past four years.
