

The latest release of the U.S. Drought Monitor has expanded and intensified drought status across Indiana (Figure 1). This map reflects conditions through early this past Tuesday (July 5th) morning, as heavy rainfall was tracking across the northeastern counties. Probabilities of rainfall continue across the state over the next several days, but the challenge is always when and how much. This time of year, scattered showers and thunderstorms are common due to the increased temperatures causing air to rise, cool, and condense into clouds.
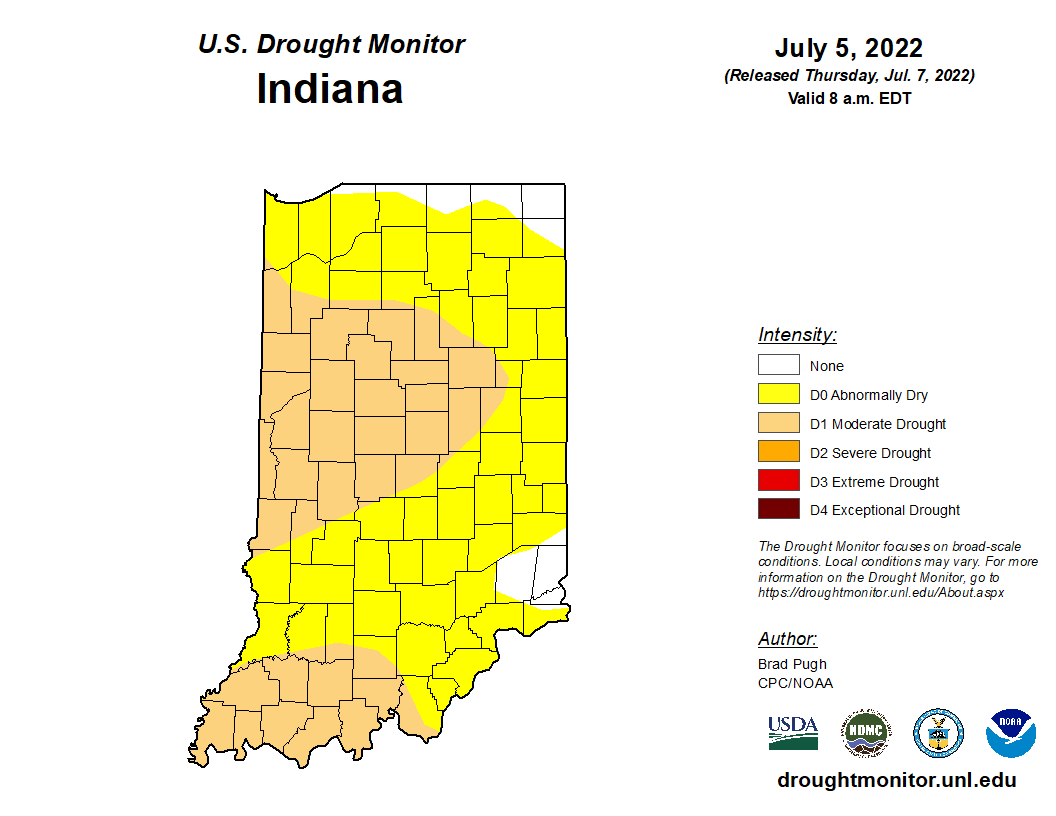
Figure 1. U.S. Drought Monitor for Indiana as of June 28, 2022.
In weather forecasts, rarely is there a full prediction that rain will or will not fall. The forecast is often expressed as a probability of precipitation (PoP, pronounced “pop”). But what does this really mean? If the PoP is 30%, that means that there is a 30% chance that rain will fall somewhere within the forecasted area. Each part of that is critical to understand. First, a 30% chance of rain also means a 70% chance of no rain. Are you a glass-half-full or glass-half-empty type of person? “That rain might fall somewhere …” means that rain does not have to fall where you are at, but somewhere in the area that forecast pertains to. Finally, “within the forecasted area” is important to think about to understand if the forecasted area is a city, town, zip code, or some other spatial region. The message here is that precipitation forecasts are essentially always going to be right if the PoPs are anything except 100% or 0%. Even if the PoPs are 100% or 0%, one can feel quite confident that precipitation will definitely (100%) or definitely not (0%) occur somewhere in the area. The more important takeaway is to realize precipitation forecasts are all about risk assessment, and only you know how much risk you are willing to take regarding that forecast. It is also important to realize that forecasts are based upon computer models that find patterns in the atmosphere and apply laws of physics. For these models to improve, more observational data is needed for the computer algorithms to consider. If you are interested in contributing to that improvement effort, please consider becoming a volunteer precipitation observer through the Community Collaborative Rain, Hail, and Snow (CoCoRaHS; cocorahs.org) program.
The climate outlooks over the next several weeks are favoring cooler-than-normal temperatures across Indiana with below-normal precipitation amounts. This is not the best news for drought impact planning, but the cooler temperatures will help lower evapotranspiration rates and make outdoor activities less oppressive. The recent extreme heat periods have continued to push accumulated modified growing degree day totals ahead of the climatological average for most of the state, with the greatest departures in central and south-central Indiana (Figure 2 and 3).
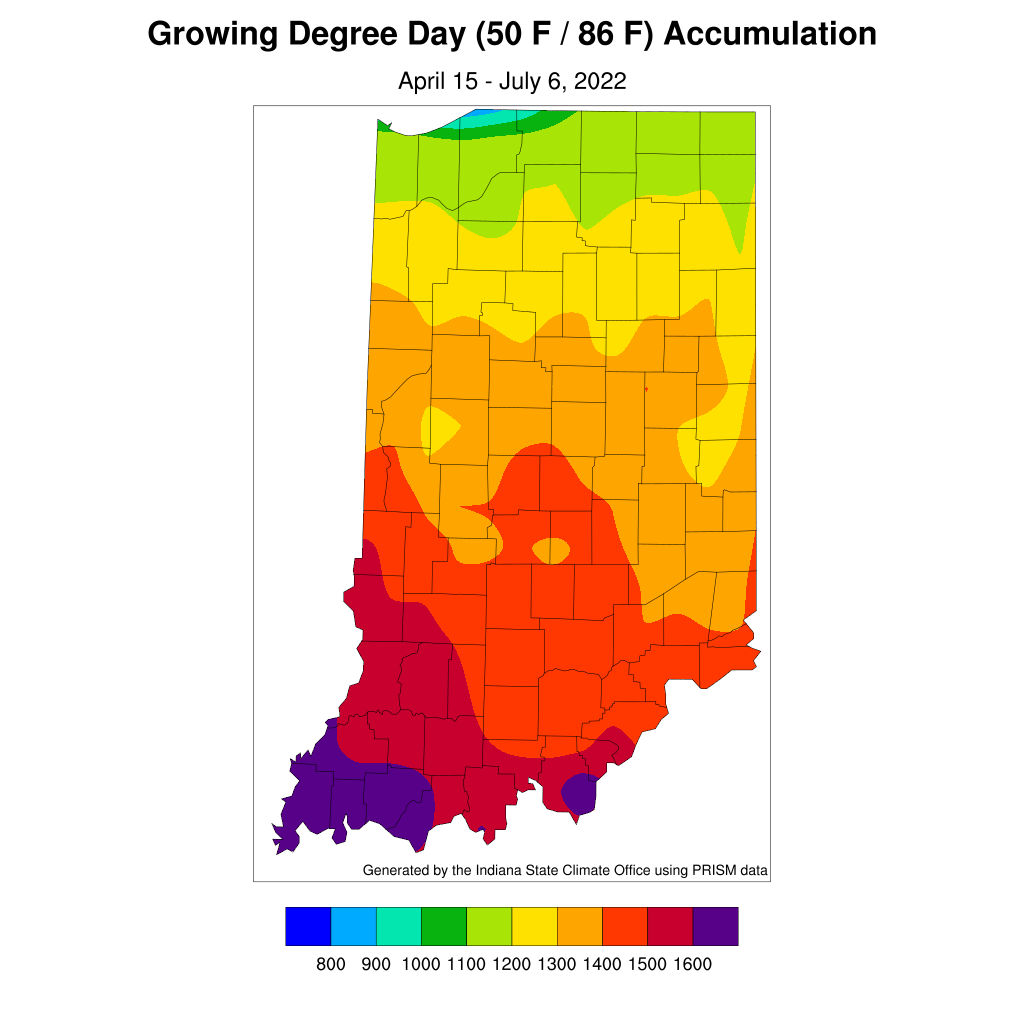
Figure 2. Modified growing degree day (50°F / 86°F) accumulation from April 15-July 6, 2022.
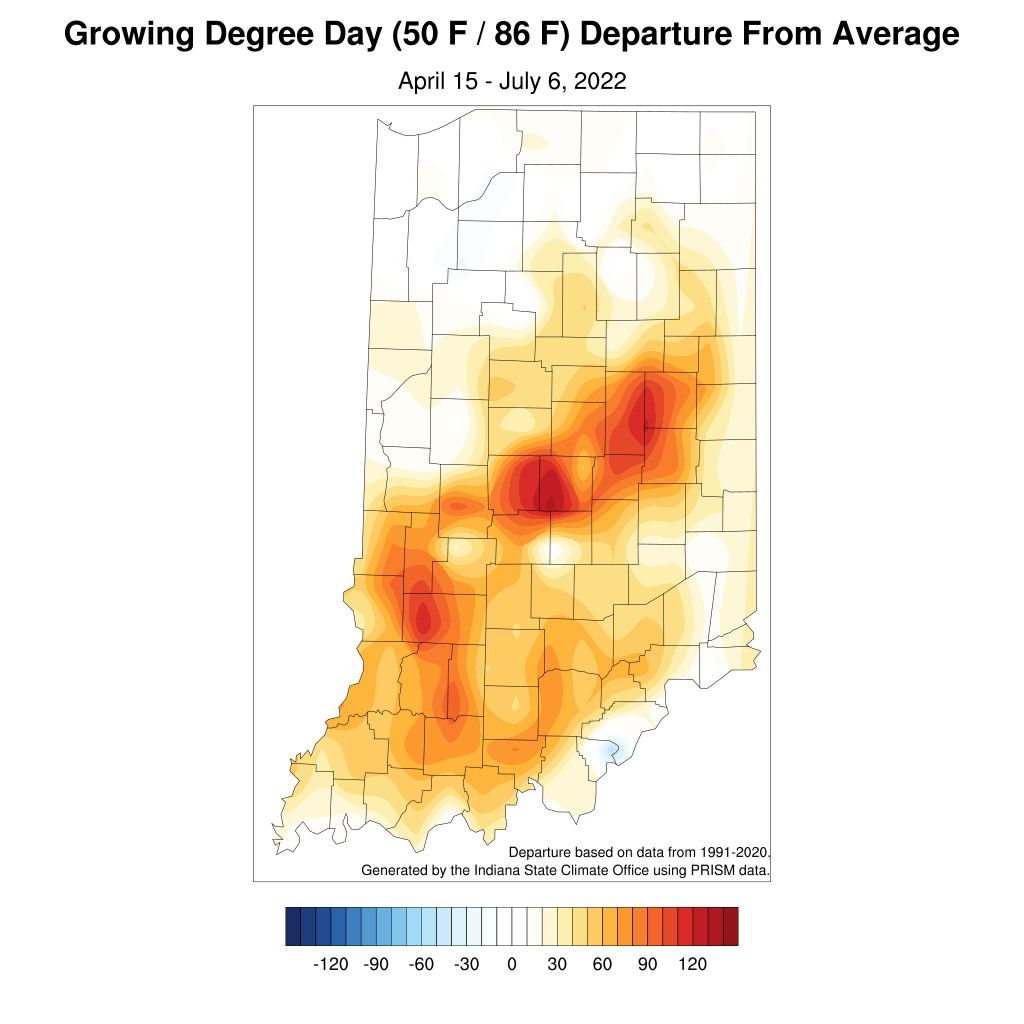
Figure 3. Modified growing degree day (50°F / 86°F) accumulation from April 15-July 6, 2022, represented as the departure from the 1991-2020 climatological average.
