

Since early June, Indiana has been seeing abnormally dry and moderate drought conditions gradually expand and intensify across the state. Conditions peaked in early July when over 94% of the state was classified as either Abnormally Dry (D0; 55% of Indiana) or Moderate Drought (D1; 39% of Indiana) according to the U.S. Drought Monitor (USDM). Since then, rain showers and larger rain events have help alleviate that stress, so the most current USDM map has only 29% of Indiana in either D0 or D1 status (Figure 1). Only central and western Indiana remains with notably dry conditions. However, with recent rain events since this last Tuesday, August 2nd, and more in the forecast (Figure 2), optimism suggests that concerns for drought intensification should be minimal. Climate outlooks produced by the national Climate Prediction Center continue to favor below-normal precipitation over the next few weeks and throughout August. However, the probability of this is still relatively low. This past spring, climate outlooks also favored below-normal precipitation and actual amounts verified this prediction. What was significant to remember was the lower amounts were spread across many more days, limiting the number of dry field days. There is a possibility that pattern could return where total monthly precipitation is below normal, but number of wet days is above normal. It is too early to know for sure, but something worth considering.
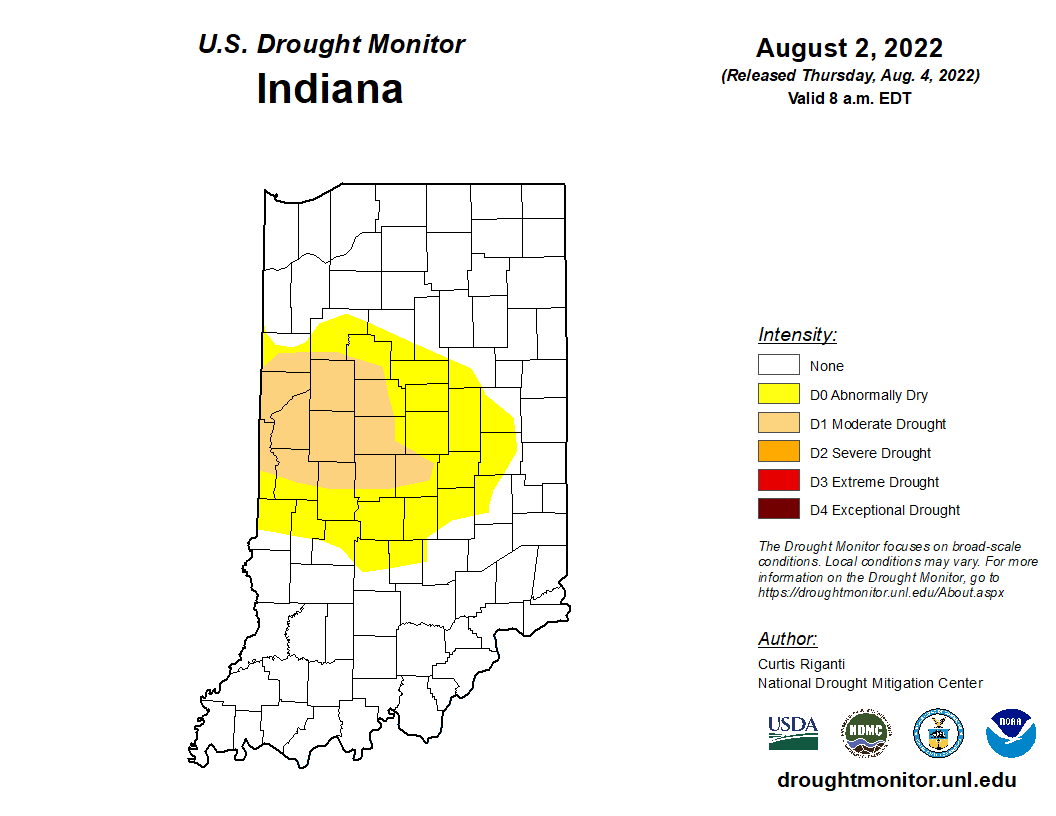
Figure 1. U.S. Drought Monitor status for conditions through Tuesday, August 2, 2022. https://droughtmonitor.unl.edu/CurrentMap/StateDroughtMonitor.aspx?IN
Figure 2. Forecasted rainfall amounts (in inches) for August 4-11, 2022. Source: Weather Prediction Center; https://www.wpc.ncep.noaa.gov/qpf/p168i.gif?1595336959
Precipitation is not the only parameter to consider when it comes to drought. A simple water balance equation notes that the amount of water entering the system (i.e., precipitation) should equal the amount leaving the system (e.g., evapotranspiration, runoff). If both sides of the equation are not relative equal, then either flooding or drought is likely to occur. The National Weather Service produces 7-day accumulated forecasts for reference evapotranspiration (Figure 3). These are useful maps to compare to the 7-day precipitation forecasts (Figure 2) to get a quick assessment of the water balance situation and to plan for potential irrigation needs over the next week. These current figures suggest that slightly more precipitation is expected to fall through August 10th / 11th than what is predicted to evaporate or transpire. Therefore, drought is unlikely to intensify under these conditions and irrigation needs may be minimal.
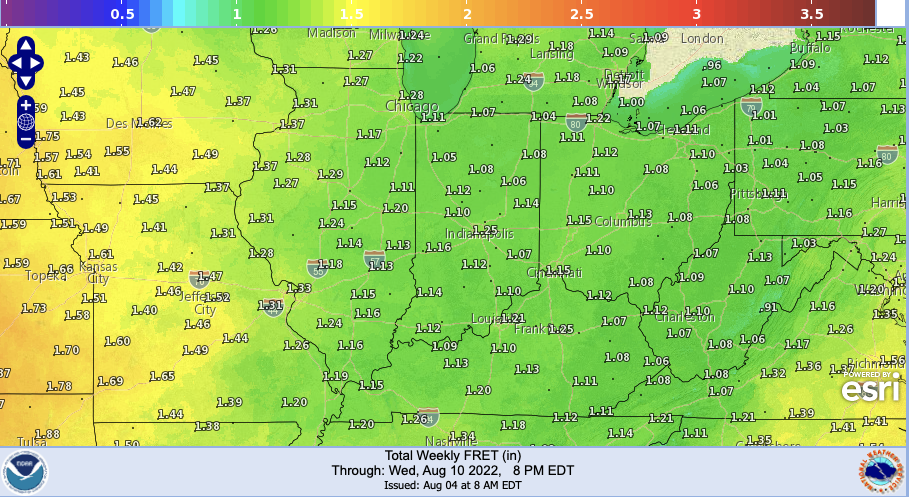
Figure 3. Total weekly forecasted reference evapotranspiration (in inches) for August 4-10, 2022. Source: National Weather Service; https://digital.weather.gov/
Figures 4 and 5 present the current accumulated and departure-from-normal modified growing degree-day maps since April 15th. If you squint your eyes and are in a good mood, you might see a fun face smiling towards Ohio and Kentucky within the departure-from-normal map!
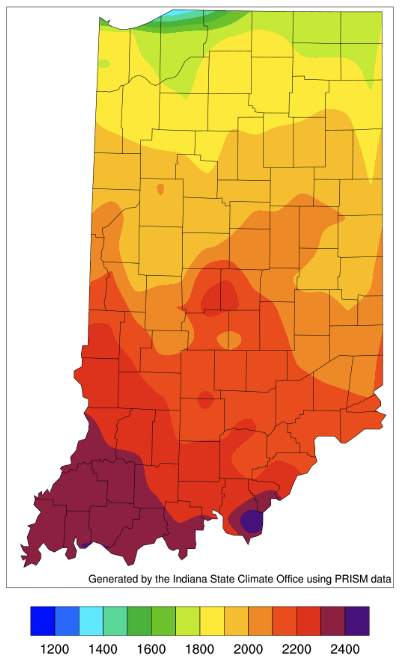
Figure 4. Modified growing degree day (50°F / 86°F) accumulation from April 15-August 3, 2022.
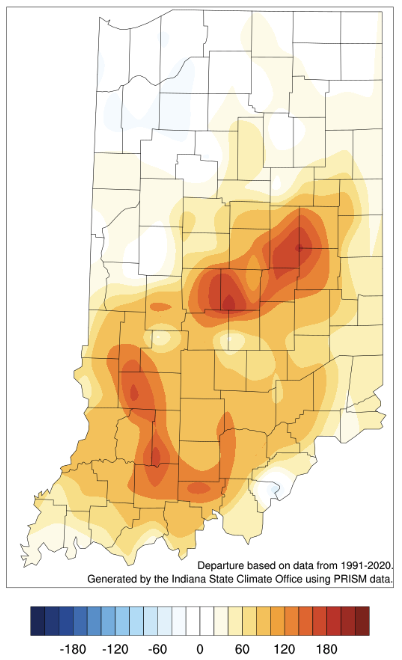
Figure 5. Modified growing degree day (50°F / 86°F) accumulation from April 15-August 3, 2022, represented as the departure from the 1991-2020 climatological average.
