

It seems the weather pattern may have shifted toward wetter conditions. Over the past week, Indiana has received over an inch of rain and the 7-day forecast is predicting at least another inch (Figure 1) in the central and southern parts of the state. The northern counties of Indiana, that have been in the Abnormally Dry status (or worse) on the US Drought Monitor, seems to continually miss the bulk or precipitation. The latest monthly outlook for May was released on April 30th and it is favoring above-normal precipitation for the month (Figure 2). Certainly, the first few weeks of May look wet; will the remainder of the month continue in that pattern? With respect to temperature, the outlooks are slightly favoring below-normal conditions which may help keep whatever rain falls from evaporating too quickly!
Over the past several months, it seems northern Indiana has not received as much precipitation as central and southern Indiana. When we examine maps that average precipitation over longer periods of times, data tends to smooth the more detailed story of individual rainfall events. However, for individual storm events, it is helpful for weather and climate experts and enthusiasts to know more specifically where higher and lower amounts of precipitation fell, even over short distances. While the federal government manages a variety of rain gauge networks, getting rainfall information every few kilometers has been challenging. In 1998, an isolated rainstorm event occurred in the mountains of Colorado that resulted in serious, unpredicted flooding. Because of the lack of observations, the National Weather Service was unable to know how much was falling and where, let alone better calibrate their radar and forecast models due to the lack of data. Thus, formed CoCoRaHS – the Community Collaborative Rain, Hail & Snow Network (www.cocorahs.org). This is a citizen science program that invites volunteers such as yourself to join, provide a standard, manual rain gauge, and take daily observations of rainfall in your area. The impact of this additional data can be striking. For example, Figure 3 illustrates a rainfall total map from an event in early January 2020 that compares data from federal observation sites compared to one that includes data from CoCoRaHS volunteers. Note the increased level of detail that the CoCoRaHS observations provide! If you’re interested in learning more about CoCoRaHS and perhaps signing up to be a volunteer, please go to www.cocorahs.org or email me at bethhall@purdue.edu.
Modified growing degree day accumulations are near average across the state, where accumulations are slightly ahead of average in the northern part of the state and slightly below average in the southern part of the state (Figures 4 and 5). Climate outlooks over the next 7-10 days are favoring below-normal temperatures, so MGDDs are not anticipated to increase at a fast rate any time soon.
Figure 1. Forecasted precipitation amounts for May 5-12, 2021.
Figure 2. Probabilistic precipitation outlook for May 2021. Predictions are favoring above-normal precipitation for the Indiana region. Source: Climate Prediction Center.

Figure 3. Comparison of maps showing interpolated precipitation observations when considering data from only the National Weather Service’s Cooperative Network (COOP; left map) to the one that includes both COOP and CoCoRaHS data (right).
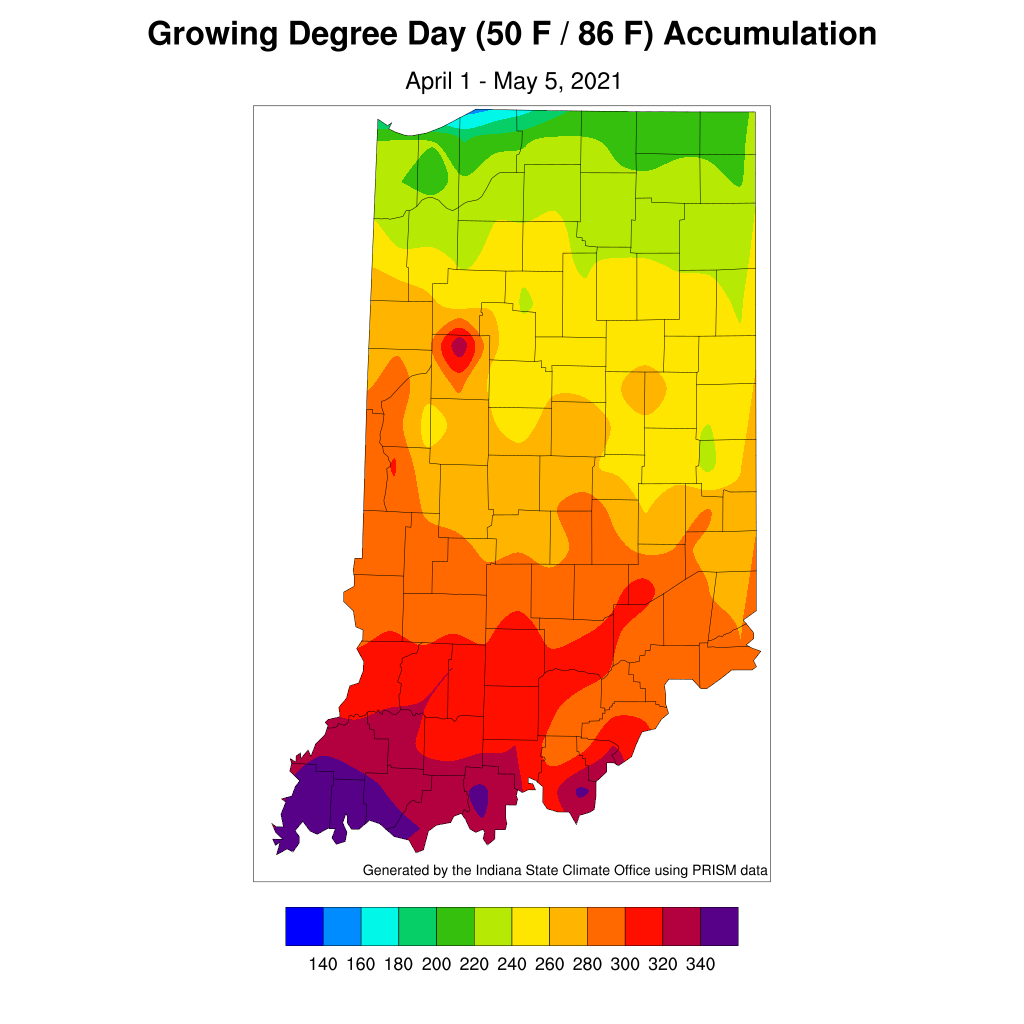
Figure 4. Modified growing degree day accumulation from April 1 to May 5, 2021.
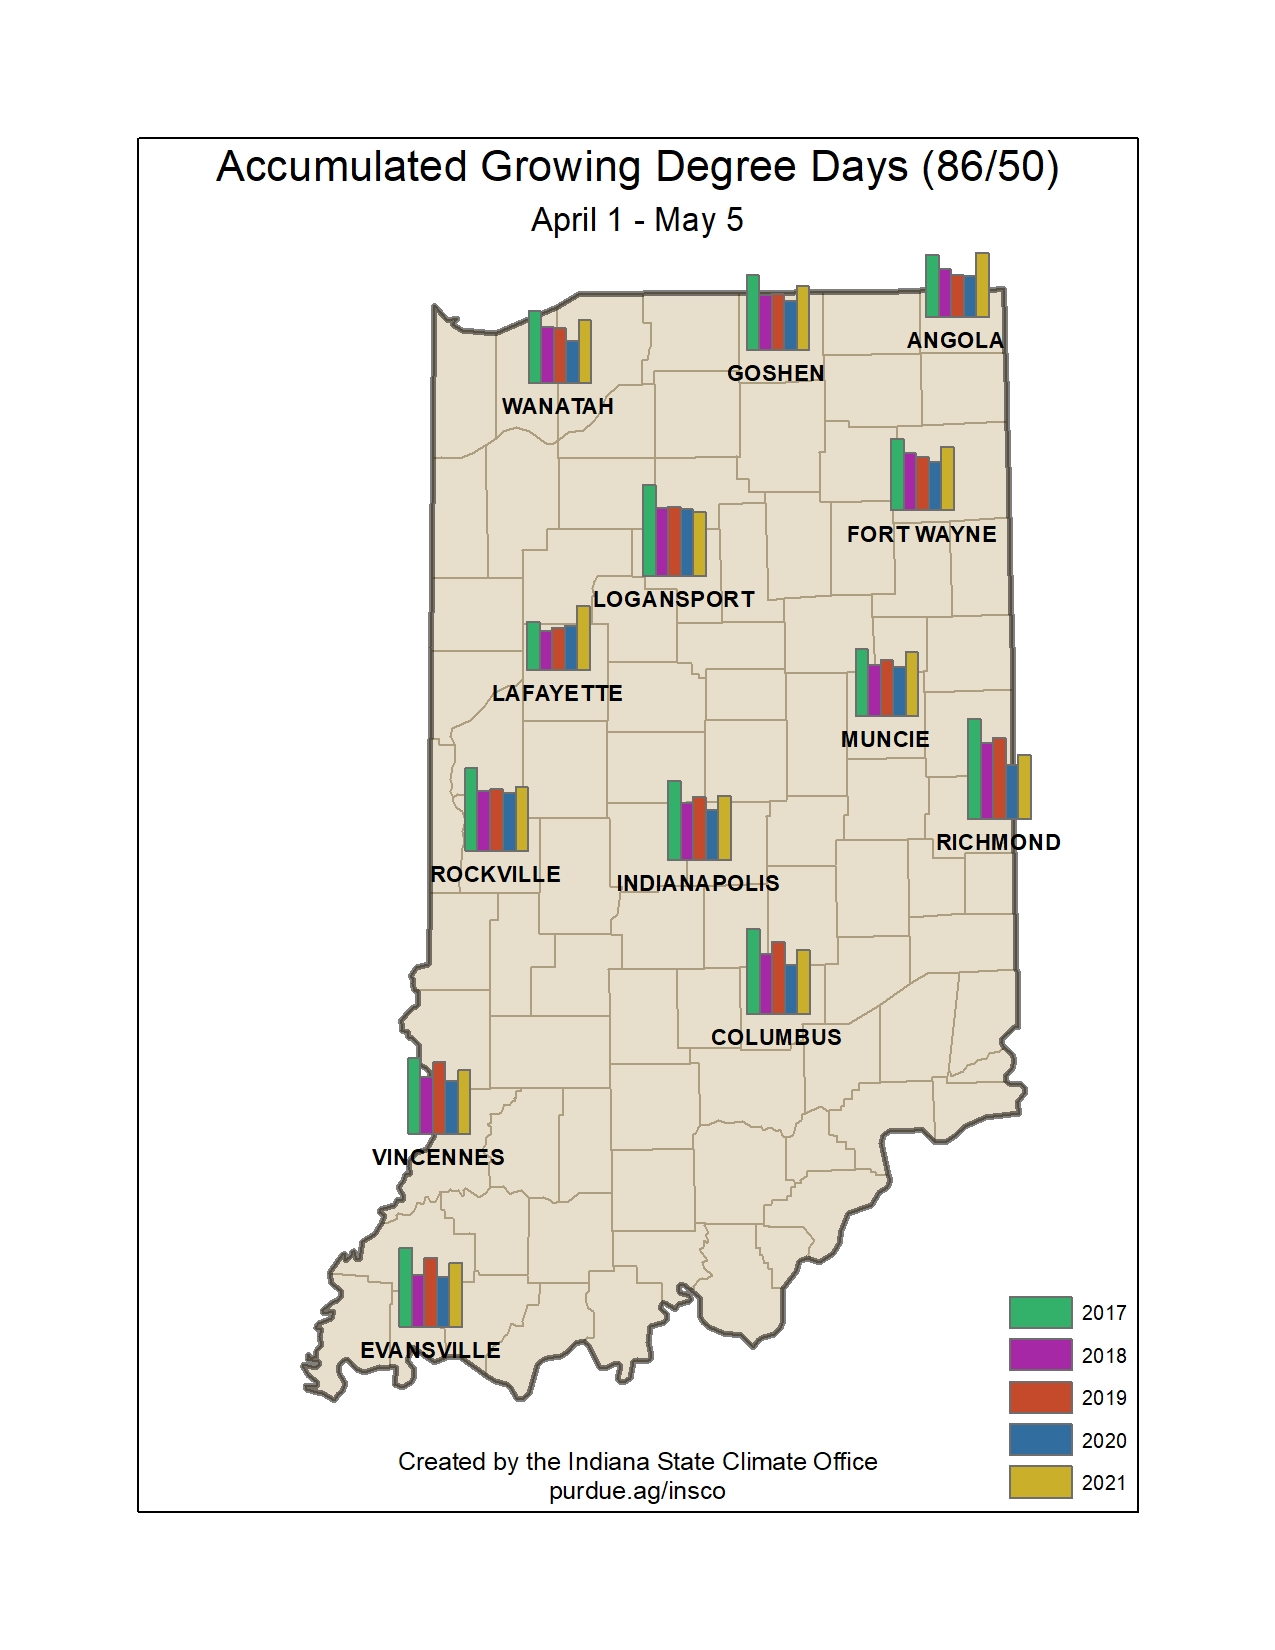
Figure 5. Comparison of 2021 modified growing degree day accumulations from average for April 1 – May 5 to the past four years.
