

If one looks at the latest U.S. Drought Monitor map for Indiana (Figure 1), one might scratch their head – particularly as it has been raining and the chance for severe weather is in the forecast for this weekend. Well, drought is a tricky thing.
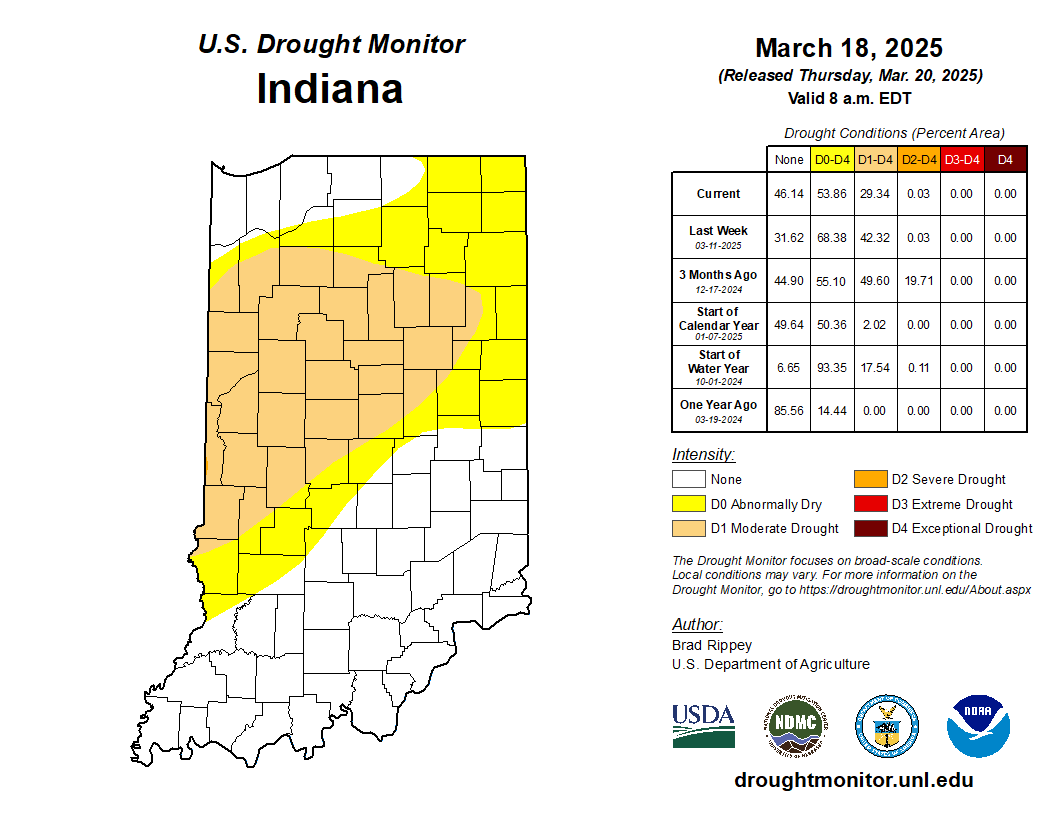
Figure 1. U.S. Drought Monitor status for conditions as of Tuesday, March 18, 2025.
Critically, there are several types of drought. Meteorological drought tends to only focus on how much precipitation has fallen and how that amount compares to historical totals for that same period. Since drought tends to consider periods of time from 30 days to several consecutive months, recent heavy rains – while likely above normal compared to that same period, historically – may not be enough to ignore the longer-termed deficits of the recent 30, 60, or 90 days. Figure 2 illustrates how the total precipitation from since February 24th and January 24th through March 25th compared to historical amounts over that same period. The maps indicate where there are warmer colors (e.g., orange) total precipitation is still below normal through parts of central and southwestern Indiana.
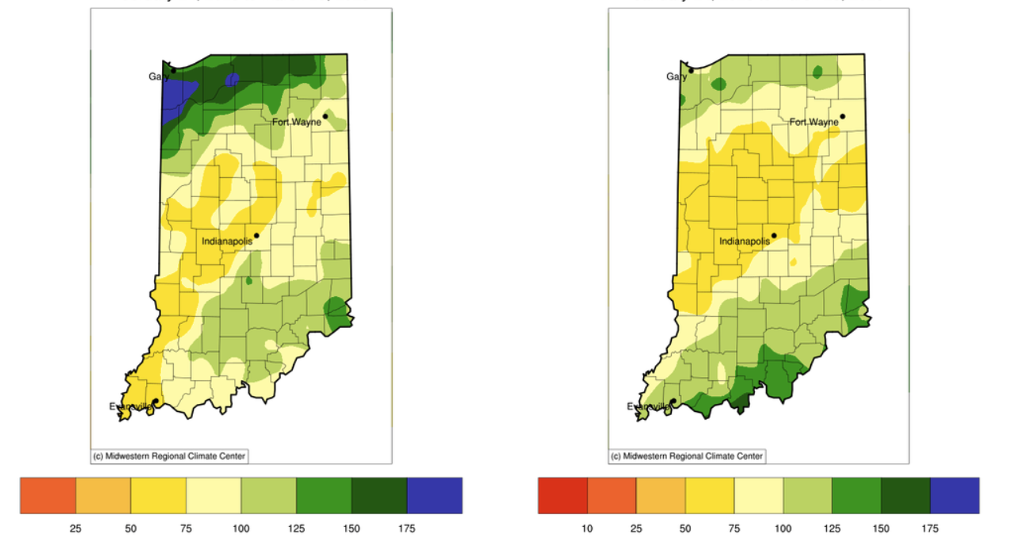
Figure 2. Precipitation represented as the percentage of normal (base period 1991-2020) where a value of 100(%) would represent normal conditions. Map on left represents precipitation from February 24 through March 25, 2025. Map on right represents precipitation from January 24 through March 25, 2025.
Another type of drought is hydrological. This focuses on impacts from precipitation deficits on water systems such as groundwater, lake and pond levels, and streamflows. Some of these can respond quickly to rainfall events (e.g., streamflows), others may take longer to recover (e.g., groundwater). Additionally, hydrological indicators may not be co-located with where the rain fell. In other words, while sufficient rain may have fallen locally, streams and groundwater that have water sources elsewhere may be significantly below normal due to a lack of precipitation elsewhere. This may result in local impacts, particularly if the streams and groundwater are a critical water source to the local environment. Figure 3 shows the 28-day averaged streamflows and ground water levels as a percentage to normal conditions. Note both products indicate areas where levels are below normal are focused in a similar area to where the U.S. Drought Monitor is indicating abnormal dryness and moderate drought.
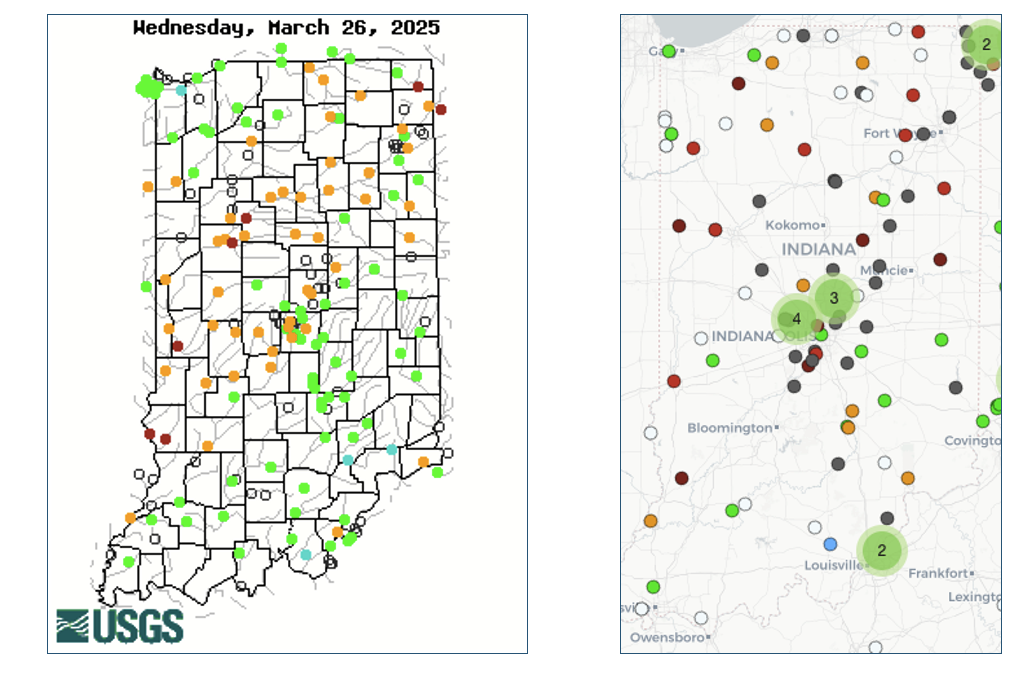
Figure 3. Hydrological maps showing 28-day average streamflow (left) and groundwater levels (right) as a percentage of normal conditions as of March 27th. Warm colors on both maps indicate below-normal conditions and cool colors indicate above-normal conditions. The circles with numbers inside on the groundwater map indicate multiple stations clustered that would have required further zooming in to see.
The last type of drought (for this article) is agricultural drought. This type can usually respond rather quickly when precipitation is abundant. Indicators can be visible stress on crops and dry soil moisture. At this time of year, there is not a lot of crop vegetation to assess drought intensity. Soil moisture monitoring from the Purdue Mesonet suggest most soils across the state are plenty moist from 2 inches down to 20 inches. However, modeled soil moisture products from the National Oceanic and Atmospheric Administration indicate soils across central Indiana, when averaged over a longer period, are drier than normal.
Ultimately, the U.S. Drought Monitor considers a wide range of indicators and products. Additionally, they invite input from state drought task teams to inform them of what the local community is seeing in addition to observational data. The Indiana State Climate Office leads this effort in Indiana along with participation from a wide range of programs such as the Indiana Department of Natural Resources, Indiana Departments of Emergency Management and Homeland Security, U.S. Department of Agriculture, National Weather Service, and Purdue Extension. The national U.S. Drought Monitor author has the final say in what the weekly map will look like. Hopefully, this helps explain why the weekly map might seem to contradict what outside conditions may look like. Period of consideration (last 30 days to 4-6 months), types of drought to consider, and the wide range of indicators must all be captured in this single product.
