

- Chance for above-normal precipitation in about 2 weeks, but for this time of the year, that doesn’t mean much.
Freezing temperatures and even some snow fell in Indiana earlier this week forcing us to accept that winter is coming. Figure 1 shows how much colder than normal those minimum temperatures got early Tuesday, October 18th. Was this a new record for the earliest freeze (defined at 32°F) in Indiana? Not quite. While the average dates of the first freeze range from October 11th in northern Indiana to October 28th in southern Indiana, the record earliest dates (going back to 1950) range from September 17th to October 1st for those respective northern and southern regions (see the Midwestern Regional Climate Center’s Freeze Date Tool [https://mrcc.purdue.edu/freeze/freezedatetool.html] for more information). In other words, this year’s first freeze of the winter season may have occurred earlier than usual in many locations (some areas of Indiana are still waiting), but it was not record breaking. If you are not quite ready to fully embrace winter and are defiantly resisting pulling out those winter clothes, you are in luck. High temperatures in the 70s are expected to return by this weekend and should stick around for a while. The temperature outlooks continue to favor above-normal conditions into early November.
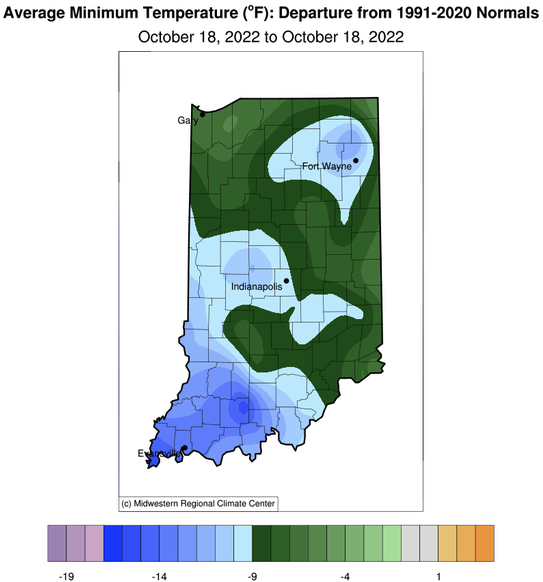
Figure 1. Minimum temperature departures from normal observed the morning (~ 8AM LT) of 18 October 2022 representing data collected since the morning (~ 8AM LT) of 17 October 2022. Actual minimum temperature values were between 30°F and 35°F across most of the state.
Precipitation continues to be well below normal across Indiana. Figure 2 shows how much precipitation has fallen across the state compared to what normally occurs over the past 30 days. Except for far northern Indiana, most of the state has received less than 25% of the typical amount for this time of year. This translates to the entire state being categorized as at least Abnormally Dry (D0 in the U.S. Drought Monitor) with several locations intensifying to the Moderate Drought (D1) stage (Figure 3). Climate outlooks for the rest of October are mixed with probabilities favoring above-normal precipitation over the next 6-10-day period, but near normal after that. Unfortunately, what is “normal” for this time of year is not a lot, so conditions are expected to remain on the drier side for a while.
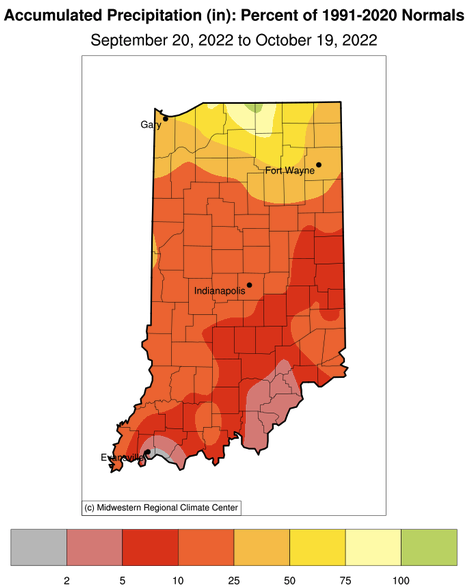
Figure 2. Precipitation represented as the percentage of normal amounts that have occurred between 20 September and 19 October. For example, red-orange shading indicates that the amount of precipitation that occurred during that period in 2022 was only 10%-25% of what typically fell during that same time period from 1991-2020.
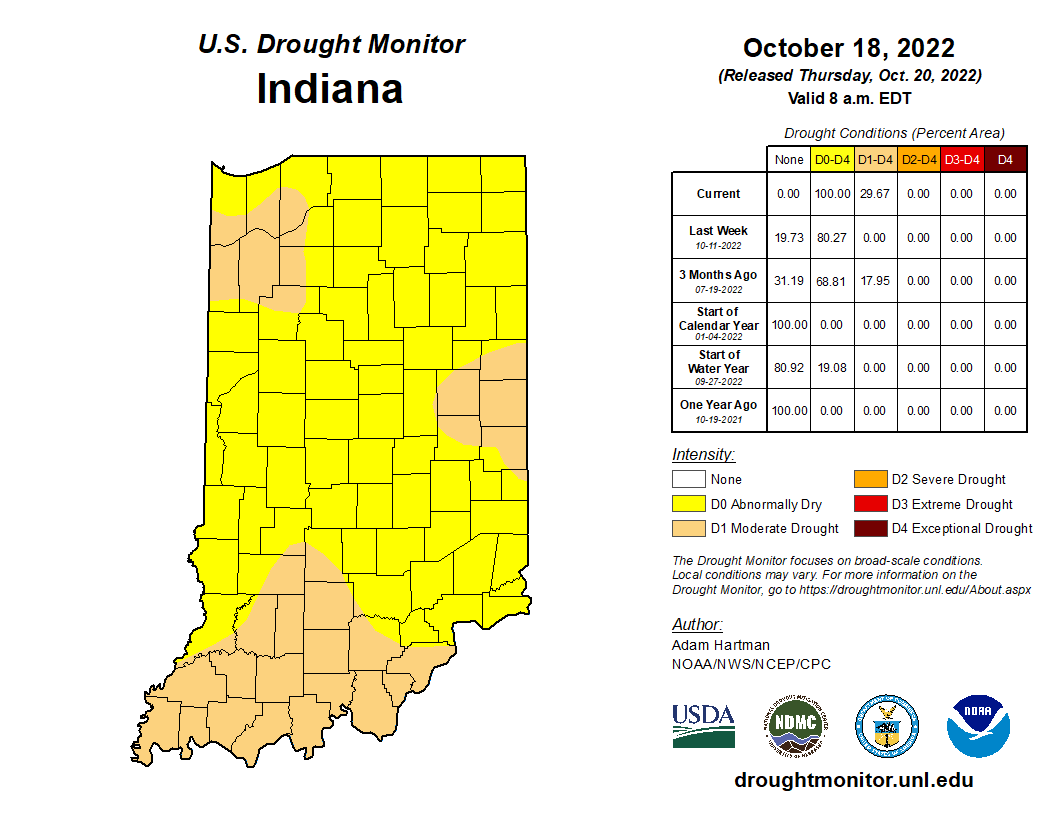
Figure 3. U.S. Drought Monitor for data through October 18, 2022.
Monthly and seasonal climate outlooks were released from the national Climate Prediction Center on October 20th. Unfortunately, the climate prediction models were not favoring either above- or below-normal conditions for either temperature or precipitation for November nor the November-December-January time period. This level of uncertainty is likely due to the ongoing La Niña event that tends to provide very little climate guidance for the Midwest this time of year. Therefore, climate predictions beyond a few weeks are likely to have very little skill with high uncertainty.
With freezing temperatures knocking at our doors, the growing season is coming to a close. Figures 4 and 5 show the latest modified growing degree-day accumulations for April 15 through October 19th including this year’s comparison to what is normal.

Figure 4. Modified growing degree day (50°F / 86°F) accumulation from April 15-October 19, 2022.
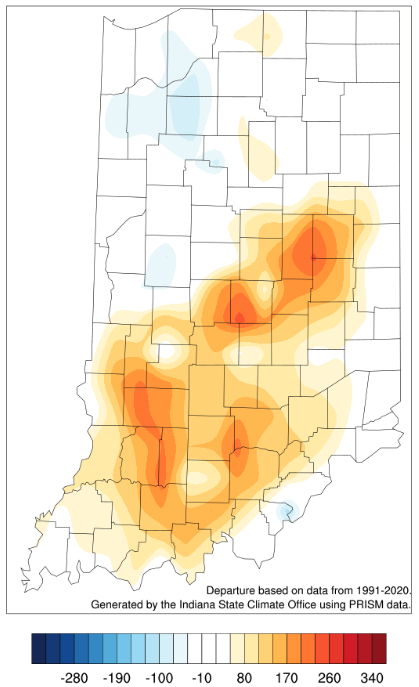
Figure 5. Modified growing degree day (50°F / 86°F) accumulation from April 15-October 19, 2022, represented as the departure from the 1991-2020 climatological average.
