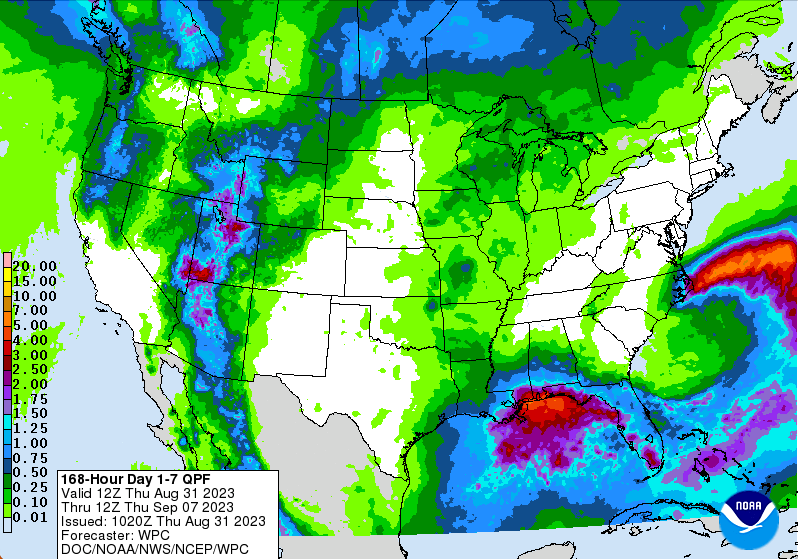
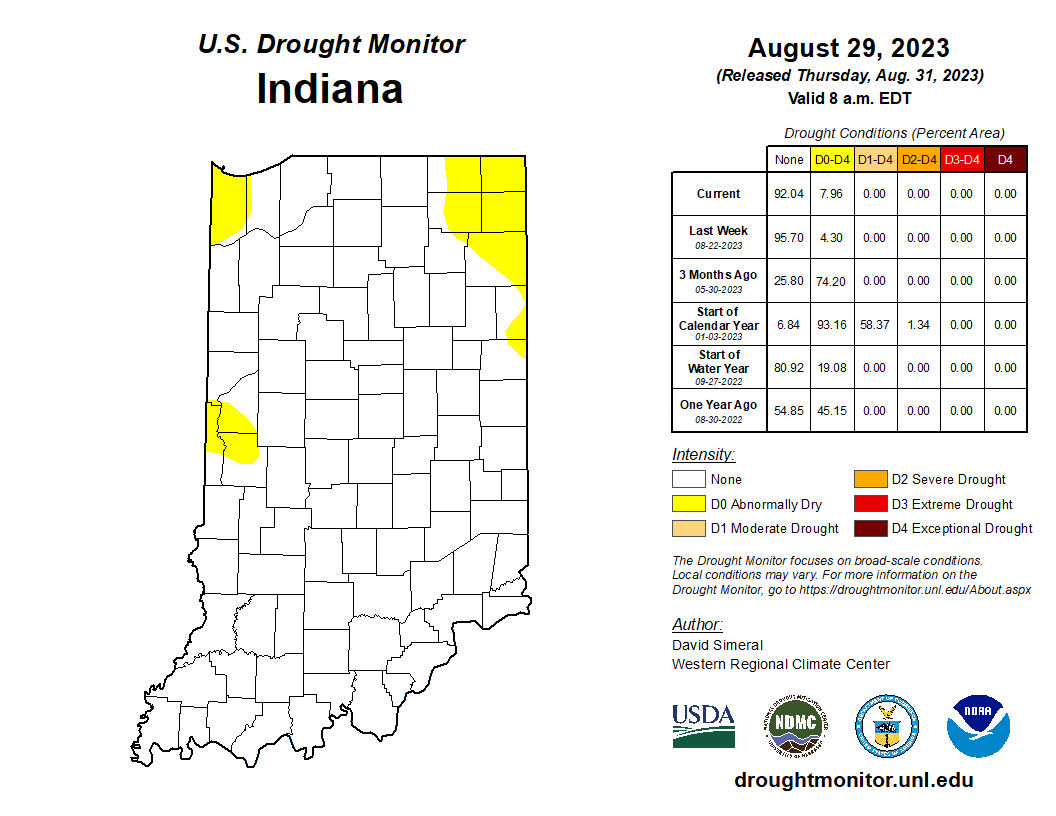
We were on a good stretch where consistent and sometimes too much rainfall eliminated drought throughout Indiana. There were a few counties still with an Abnormally Dry (D0, according to the U.S. Drought Monitor (USDM)) classification, but with just a few more rainfall events even those should have been eliminated. Mother Nature – or more accurately a persistent high-pressure area over a large part of the US, including Indiana – had other ideas. The last time most of Indiana received rainfall was August 17th (the Augusts 25th rain event only favored southern Indiana). Fortunately, humidity and dew-point temperatures have been high the last few weeks to minimize the rate of evapotranspiration, but any lack of rain coupled with high temperatures is going to dry things out. The latest USDM map (Figure 1) shows Abnormally Dry conditions starting to spread again across the state, creeping in from the northern corners. Climate outlooks for the next 2 weeks are favoring high probabilities of above-normal temperatures with below-normal precipitation. Indiana may once again be entering a period of Moderate Drought (D1 on the USDM). Even the 7-day precipitation forecast is predicting most of the state to receive little-to-no rain (Figure 2). Some crops may prefer this drying period, but others may have benefited from just a few more inches of rain to get them through the season.

Figure 2. Seven-day total precipitation forecasted for the period from August 31 through September 7, 2023. The small amount forecasted for Indiana is likely to fall toward the end of that 7-day period.
Meteorological autumn begins September 1st. This means shorter days and (hopefully) cooler temperatures. However, while the length of daylight each day is very predictable, don’t forget that autumn is a “transition season” where the atmosphere will be battling it out between keeping summer conditions around and letting winter conditions develop. That means an increased potential for wide swings in temperatures every few days. This autumn should be no different, so don’t be surprised if your wardrobe quickly becomes a mixture of shorts and sweaters!
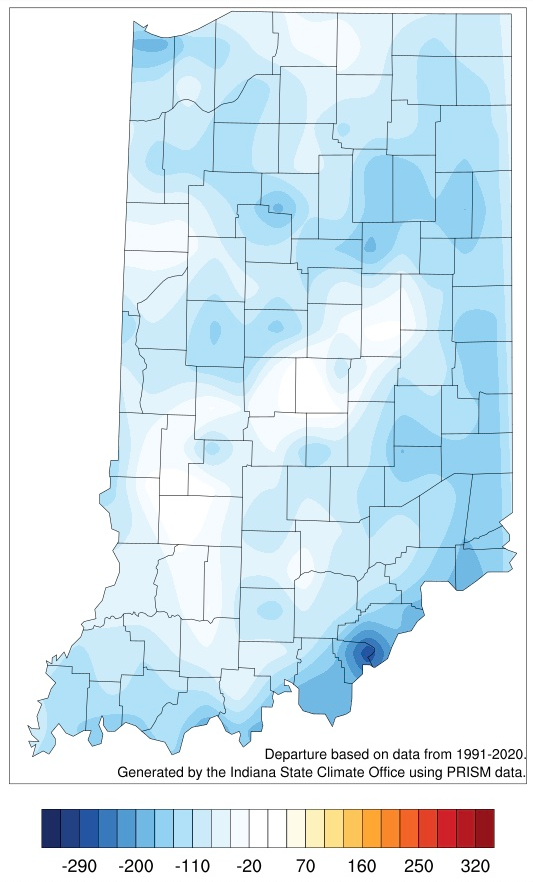
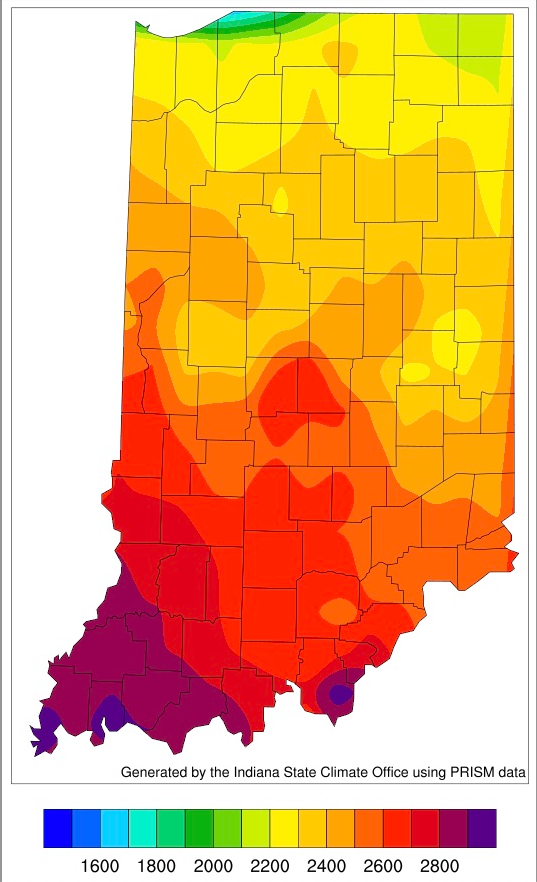
Modified growing degree day accumulations since mid-April now range from 2100 units in northern Indiana to over 2800 units in the south (Figures 3 and 4). This range is within around 125 units of normal (on the below-normal side).

Figure 4. Modified growing degree day (50°F / 86°F) accumulation from April 15-August 30, 2023, represented as the departure from the 1991-2020 climatological average.


