SUMMARY: Results from 81 field scale trials around Indiana since 2008 suggest that maximum yield response to plant populations for 30-inch row corn grown under minimal to moderate stress conditions occurs at about 31,600 PLANTS per acre (ppa), equal to seeding rates of about 33,250 SEEDS per acre (spa). Corn grown under extremely challenging conditions (e.g., severe drought stress) may perform best at PLANT populations no higher than 22,800 ppa and perhaps as low as 21,000 ppa under truly severe growing conditions (e.g., actual drought, non-irrigated center pivot corners, non-irrigated sandy fields with minimal rainfall). Economic optimum populations are several thousand lower than the agronomic optimum.
The cost of seed corn is the largest single variable input cost for most Indiana corn growers (Dobbins et al., 2017). Minimizing that cost involves a combination of shrewd purchasing skills and wise selection of seeding rates. This summary focuses on our recent research evaluating the yield response of corn to plant population in field scale trials conducted around the state of Indiana.
Reported corn plant populations have increased steadily in Indiana for the past several decades, at an annual increase of approximately 330 plants per acre (ppa) per year, based on historical data from the USDA National Agricultural Statistics Service (NASS). In 2016, the average reported plant population across the state was approximately 29,800 PLANTS per acre (USDA-NASS, 2017). Considering stand establishment success typically ranges from 90% to 95%, the average reported population suggests that the average seeding rate statewide is 31,000 to 33,000 seeds per acre (spa). Among the agronomic factors that support the steady annual increase in plant populations has been the genetic improvement in overall stress tolerance that has resulted in a) ear size and kernel weight becoming less sensitive to the stress of thicker stands of corn and b) improved late-season stalk health.
Field Scale Plant Population Trials
Since 2008, we have conducted 89 field scale trials at Purdue Ag. Research Centers and in collaboration with growers around the state. Typical trial sizes ranged from 30 to 100 acres and commercial farming equipment was used for all field operations. Individual plots were typically length of field by twice the width of the combine header.
All of the trials involved 30-inch row spacings, with the exception of a couple of twin- row planter trials (data not included because too few trials). Five to six seeding rates were evaluated in each replicated trial, ranging from about 25,000 to about 42,000 spa. Most of the trials were planted using variable seeding rate technologies and “prescription” seeding rate files developed with our GIS software prior to planting.
Most of the trials involved individual hybrids commonly grown by farmers, but 27 trials were split-planter comparisons using pairs of hybrids deliberately chosen for their advertised differences in response to population. For most of the trials, a single nitrogen (N) fertilizer rate, determined by the farmer’s normal N rate, was applied to all seeding rate treatments. However, 8 trials evaluated yield response to plant population at normal and higher than normal N rates.
Grain yields were estimated at harvest with commercial combines equipped with GPS- enabled yield monitors. The resulting spatial yield data were processed after harvest with GIS software to eliminate any obvious non-treatment field variability that might unfairly skew the results (e.g., wet holes, gullies, planter skips). The mean yield and grain moisture for each individual plot was calculated from the remaining yield data points of each plot. The statistical quality of the data from these field scale trials was generally excellent and better than what we typically obtain with small-plot trials. Consequently, yield response to plant population can be more accurately quantified.
Eight of the 89 trials exhibited no yield response to plant populations greater than 22,000 to 26,000 ppa. For two of those trials, the lack of yield response was due to unexplainable excessive variability in the trial data. A third trial was severely stressed early in the season by excessively wet soil conditions. The other five trials were fairly uniform with minimum stress and average yields, but there was simply no yield response to population. None of these trials were included in the subsequent aggregated data analysis.
The overall average yield level of the remaining 81 trials ranged from less than 100 bushels per acre (bpa) to nearly 250 bpa. For each of those trials, the grain yield response to plant population was quantified using regression analysis. Yield response to plant population was similar throughout the state (i.e., no regional differences).
However, yield response to population was different for “severely stressed” sites versus those that experienced a “normal” range of growing conditions. We characterized fourteen of the 81 responsive trials as “severely stressed”, primarily due to extremes in soil moisture conditions (excessively wet or excessively dry). The results of these 14 trials provide us insight into the relative risk of higher seeding rates for crops under severe stress.
Consequently, the results are presented separately for the bulk of the trials that experienced what we consider to be a “normal” range of growing conditions and the 14 trials that we characterized as “severely” stressed. For each of the two groups of trials, regression-based yield estimates for the individual trials were then aggregated to estimate the overall average grain yield response to plant population for “severely stressed” and “normal” growing conditions.
Yield responses were analyzed with respect to PLANT populations rather than seeding rates because final populations are usually lower than the seeding rates due to germination problems, emergence problems, or subsequent plant mortality. Knowledge of your historical stand establishment success allows you to convert recommended final PLANT populations to SEEDING rates. In our 90 trials, the average percent stand (final population divided by seeding rate) is 95%, but ranges from 79% to 100%.
Example: If the recommended PLANT population is 30,000 ppa and your historical percent stand is 95%, then the targeted SEEDING rate would be 30,000 divided by 0.95 or 31,579 SEEDS per acre.
To document historical percent stand establishment, growers should routinely calibrate the seed drop of their planters, count established plants no earlier than V6 (six visible leaf collars), and calculate percent stand in all of their fields every year to determine whether there is room for improvement in stand establishment. With today’s planter technologies and seed quality, aiming for a percent stand of no less than 95% is a realistic goal.
Results of the trials
“Normal” Growing Conditions. For the 67 responsive trials that represented a “normal” range of growing conditions (minimal to moderate stress), the Agronomic Optimum Plant Population1 (AOPP) averaged 31,600 ppa (Fig. 1). Using an average percent stand of 95%, that would translate to a SEEDING rate of 33,250 spa.
The AOPP among the individual 67 trials ranged from just under 22,000 to just under 44,000 ppa with 68% of the trials ranging from 26,000 to 34,000 ppa (Fig. 2). We were not able to identify specific factors (e.g., hybrids, yield level, planting dates, rainfall) that correlated well with the observed range of optimum populations.
To date, we have not been able to distinguish differences among regions of the state for yield response to plant population. Consequently, we believe the average AOPP of 31,600 ppa to be widely applicable throughout Indiana, except for severe stress conditions as noted in the next sub-section.
The relationship between yield level (field productivity) and AOPP for these 67 trials is not strong, even though yield levels among the 67 trials varied from 140 to 245 bpa (Fig. 2). This result suggests that if spatial variability for grain yield within a specific field was within this range of yields, there may be minimal value to variable rate seeding.
Severe Stress Conditions. The average AOPP for the 14 severely stressed trials that averaged 116 bpa was 22,800 ppa (data not shown). At a 95% stand establishment rate, the 22,800 PLANT population would equal a SEEDING rate of about 24,000 spa. Among the 14 individual trials, the AOPP ranged from 20,400 to 33,000 ppa and optimum yields ranged from 71 to 168 bpa (data not shown).
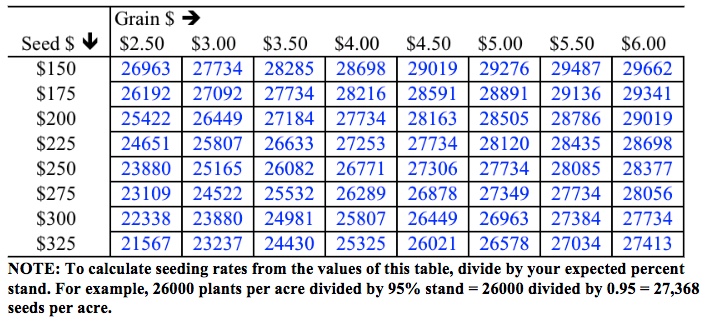
Economics. Market price for grain, cost of seed, and the mathematical nature of the yield response curve all influence the marginal dollar return to seed. Because of the non-linear nature of corn yield response to plant population (Fig. 1), the Economic Optimum Plant Population (EOPP) will always be less than the AOPP. Table 1 provides estimates of EOPP calculated for a range of grain prices and seed costs, using the average grain yield response curve for the 67 responsive trials that represent “typical” growing conditions in Indiana. The nearly “flat” nature of the yield response curve (Fig. 1), combined with the effects of market price and seed cost, results in economic populations (maximum dollar return) several thousand lower than the agronomic optimum populations.
The estimates for EOPP shown in Table 1 factor in the extra seed cost associated with a 95% stand establishment rate. If percent stand in your fields is historically lower than that, then you either need to figure out how to improve the success of stand establishment or you need to use a higher seeding rate just to achieve the desired economically optimum final stand and, therefore, incur even more seeding cost.
Note: Improving your historical stand establishment from 90 to 95% allows you to use less seed to achieve your desired final stand and would be worth about $6 per acre in saved seed costs at $300 per bag.
Hybrid Comparisons. Twenty-seven of the 81 responsive trials included a side by side comparison of pairs of hybrids that were characterized by the seed companies as being either “less” or “more” responsive to plant populations. The pairs of hybrids represented 8 different seed companies. Of the 27 paired-hybrid trials, significant differences between purposely-paired hybrids for yield response to plant population were detected in only 11 trials (data not shown). In 3 of those 11 trials, the hybrid rated as “less responsive” actually had a slightly higher optimum population than the “more responsive” hybrid, i.e., opposite of what the seed company ratings would suggest (data not shown).
Confused? The “take home” message from these 27 paired hybrid trials is that hybrid ratings for yield response to plant population are apparently not “black and white”. Consequently, hybrid choice appears to not be critical when selecting a seeding rate.
Effect of Nitrogen (N) Fertilizer Rate. Eight of the 81 responsive trials included both the farmer’s normal N rate and a rate from 50 to 75 lbs. higher than normal with the objective of determining whether yield response to plant population might be encouraged by higher N rates. However, yield response to plant population was not influenced by N rate in any of these eight field trials (data not shown).
1 Definitions: Agronomic Optimum Plant Population (AOPP) is that which maximizes grain yield per acre. Economic Optimum Plant Population (EOPP) is that which maximizes dollar return per acre.
Summary
Results from 81 field scale trials around Indiana suggest that agronomic optimum (maximum yield) plant population for corn grown under typical yield levels and growing conditions is approximately 31,600 ppa or seeding rates of about 33,250 spa at 95% stand. The results further suggest that corn grown under severely stressful conditions may perform best at plant populations no higher than 22,800 ppa and perhaps as low as 21,000 ppa under truly severe growing conditions (actual drought, non-irrigated center pivot corners, non-irrigated sandy fields with minimal rainfall, etc.).
Economic optimum plant populations are several thousand ppa less than agronomic optimum plant populations because of the nearly “flat” yield response to population. The magnitude of the difference between agronomic and economic optimum plant populations is also influenced by grain price and seed cost.
There is little evidence from these trials that hybrids characterized as “more” responsive to population respond consistently differently to plant population than hybrids characterized as being “less” responsive. There is also no evidence from these trials that higher than normal N fertilizer rates influence yield response to plant population.
On-Farm Field scale Seeding Rate Trials: We Need Your Help!
The field scale trials summarized in this report were scattered throughout the state and represent a wide range of growing conditions. However, more such trials are needed to better identify the possible effects of different growing conditions, hybrids, and N fertilization levels on yield responses to plant population. Field scale on-farm seeding rate trials are simple to conduct if your planter is equipped with GPS-enabled variable rate controls because we can create a “prescription” file for the trial that “tells” the VR controller where to automatically change seeding rates during planting. With a bit more effort, on-farm seeding rate trials can also be conducted without variable rate controls.
We encourage you to consider collaborating with us to conduct field scale seeding rate trials on your farm. These trials can be customized to include two or more nitrogen fertilizer rates or two hybrids. Such trials will help you better identify the “ballpark” optimum plant populations for your conditions and can also be used to evaluate yield response to plant population in different areas or “zones” within fields to help address the question about the relative merits of variable rate seeding.
If you would like to participate in one or more on-farm seeding rate trials with corn, please download the protocol for this at the following URL and contact Bob Nielsen (rnielsen@purdue.edu) for additional information.
http://www.agry.purdue.edu/ext/ofr/protocols/PurdueCornSeedingRateProtocol.pdf
Acknowledgements
The field scale research summarized in this update has been supported, in part, by funds from the Indiana Corn Marketing Council, the Purdue Mary S. Rice Farm Fund, and the Indiana Certified Crop Adviser Program. Donation of seed corn by DuPont-Pioneer and Stine Seed Company for field trials at Purdue Ag. Research Centers is gratefully acknowledged. Finally, the collaboration of the participating farmers, crop consultants, retail agronomists, county Extension Educators, and Purdue Ag. Research Center personnel is gratefully acknowledged.
Cited references
Dobbins et al. 2017 (Jan). Purdue Crop Cost & Return Guide. Purdue Extension. Purdue Extension. https://goo.gl/WlTMaz. [accessed Feb 2017].
USDA-NASS. 2017 (Jan). Crop Production 2016 Summary. USDA – Nat’l Ag. Statistics Service, Washington, D.C. https://goo.gl/MTXglU [accessed Feb 2017].
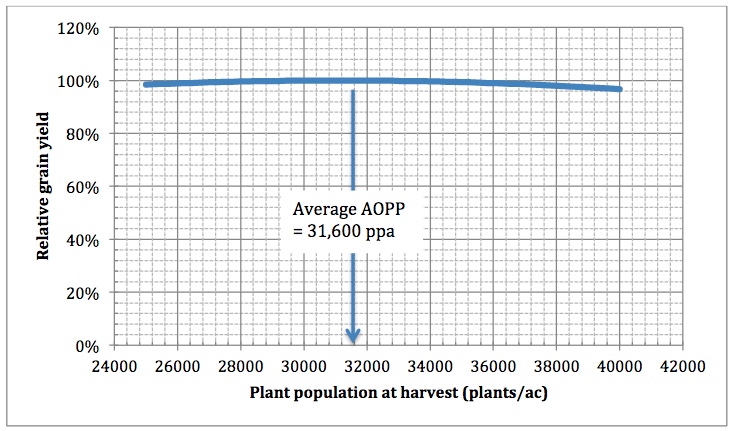
Fig. 1. Average grain yield response of corn (relative yield, 0 to 100%) to plant populations at harvest (plants per acre), based on the aggregated results of 67 field scale trials conducted across Indiana from 2008 to 2016 that represented a normal range of growing conditions (minimal to moderate stress). The agronomic optimum population (AOPP) for this group of trials was 31,600 plants per acre at harvest with an average yield of 196 bushels per acre.
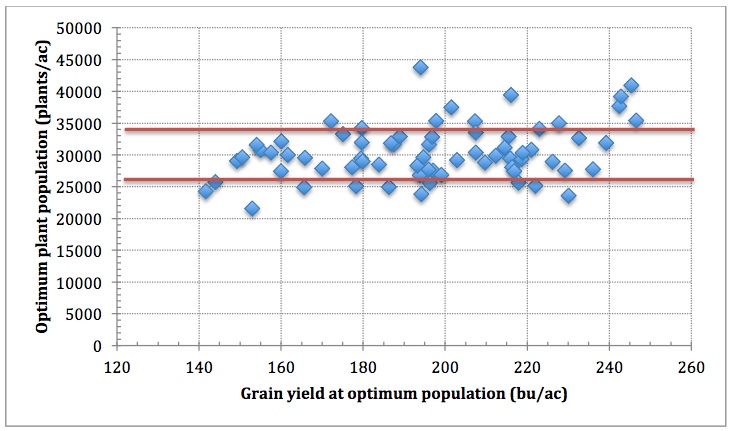
Fig. 2. Optimum plant population versus grain yield at the optimum population for each of 67 field scale trials across Indiana from 2008 to 2016 that represented a normal range of growing conditions (minimal to moderate stress). The average optimum PLANT population was 31,600 ppa and 68% of the individual trial optimum PLANT populations were between 26,000 and 34,000 ppa (between the dark lines on the graph).
Table 1. PLANT populations that maximize marginal return to seed (EOPP) for combinations of market grain price (per bu.) and seed cost (per 80,000 seed unit), based on average yield response to population in 67 Indiana trials conducted from 2008 – 2016 that represented a common range of growing conditions (not severe stress conditions). The estimated economic optimum populations assume stand establishment success equals 95% of the seeding rate.