

This past week has been so enjoyable temperature- and humidity-wise that it was easy to hope that it was going to stay this way for several more weeks. But alas, these good times are coming to an end. The national Climate Prediction Center is indicating significant probabilities of above-normal temperatures at least through August 30th (Figure 1). After that, the climate models simply could not form a reliable consensus on whether temperatures are expected to be above or below normal. The good news, however, is that normal temperatures continue to cool as we move away from summer, so what may be defined as “above normal” may not be all that miserable.
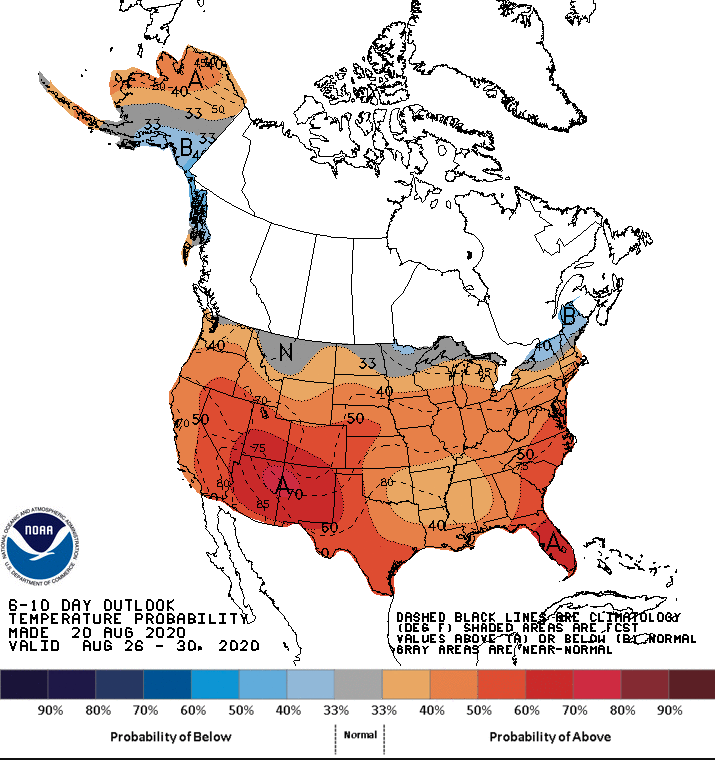
Figure 1. The national Climate Prediction Center’s climate outlook for August 26-30, 3030 indicating the probability of above-normal temperatures.
Abnormally dry conditions continue in northern Indiana in contrast to the southern half of the state that is still clinging to the moisture received from rain events over a week ago. Unfortunately, there is not a lot of rainfall predicted over the next seven days (Figure 2), so anticipate conditions to continue drying, particularly with above-normal temperatures enhancing those evapotranspiration rates!
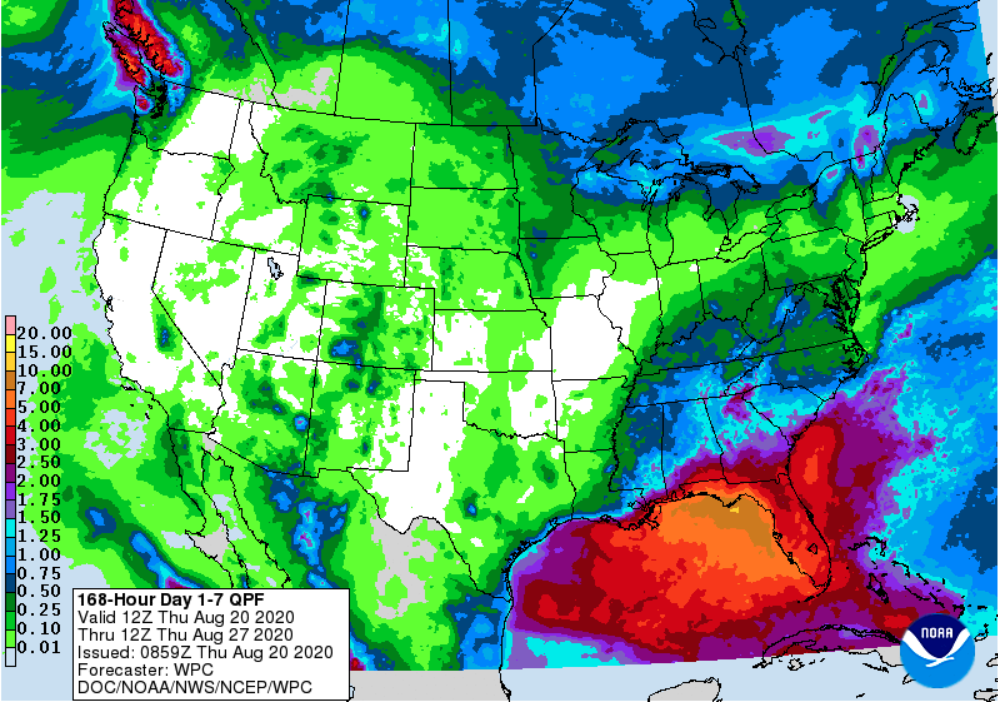
Figure 2. The National Weather Service’s 7-day accumulated precipitation forecast for August 20-27, 2020.
Accumulated modified growing degree days (GDDs) continue trying to catch up with previous years (Figures 3 and 4). It will be interesting to see if the warmer temperature for the rest of August will push this year’s GDDs ahead of the pack. It is a race I am sure all of us are on the edges of our seats in anticipation of the outcome.
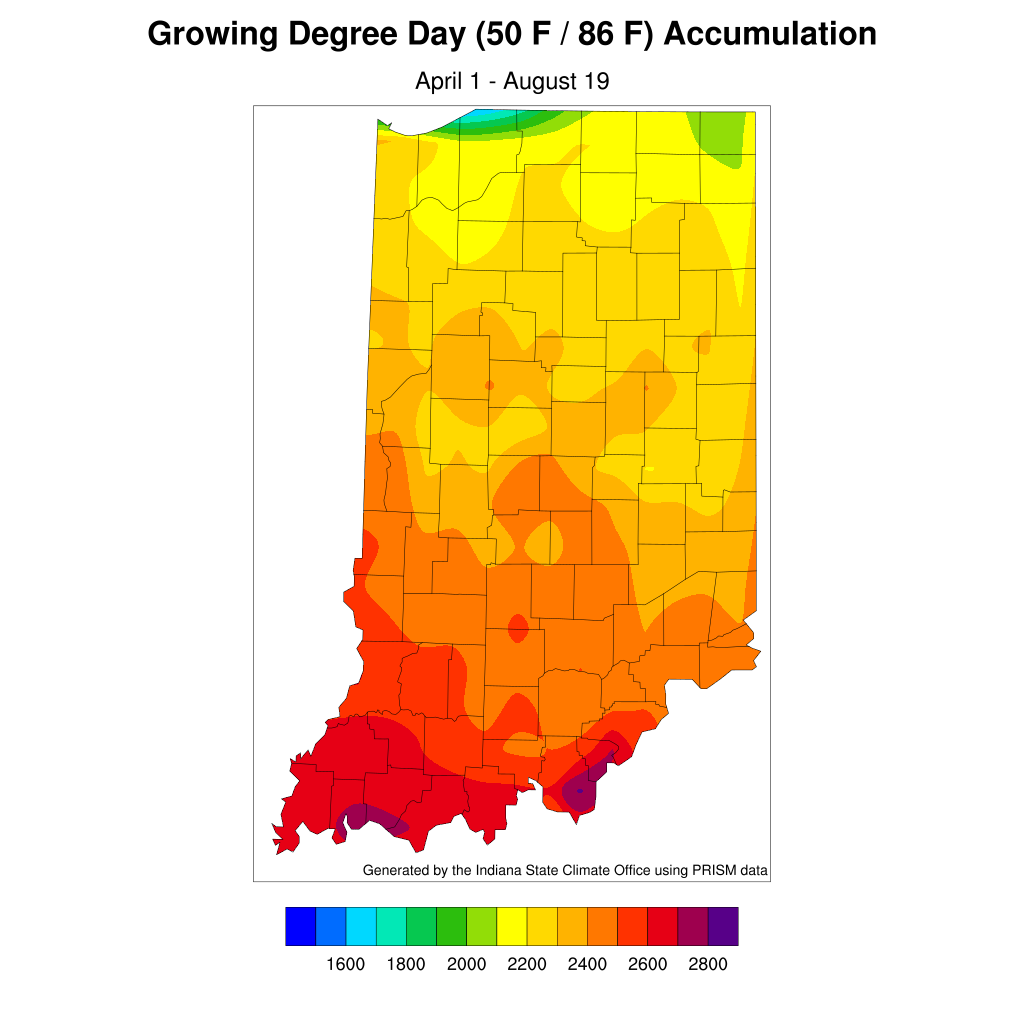
Figure 3. Modified accumulated growing degree-day units for April 1 – August 19, 2020.
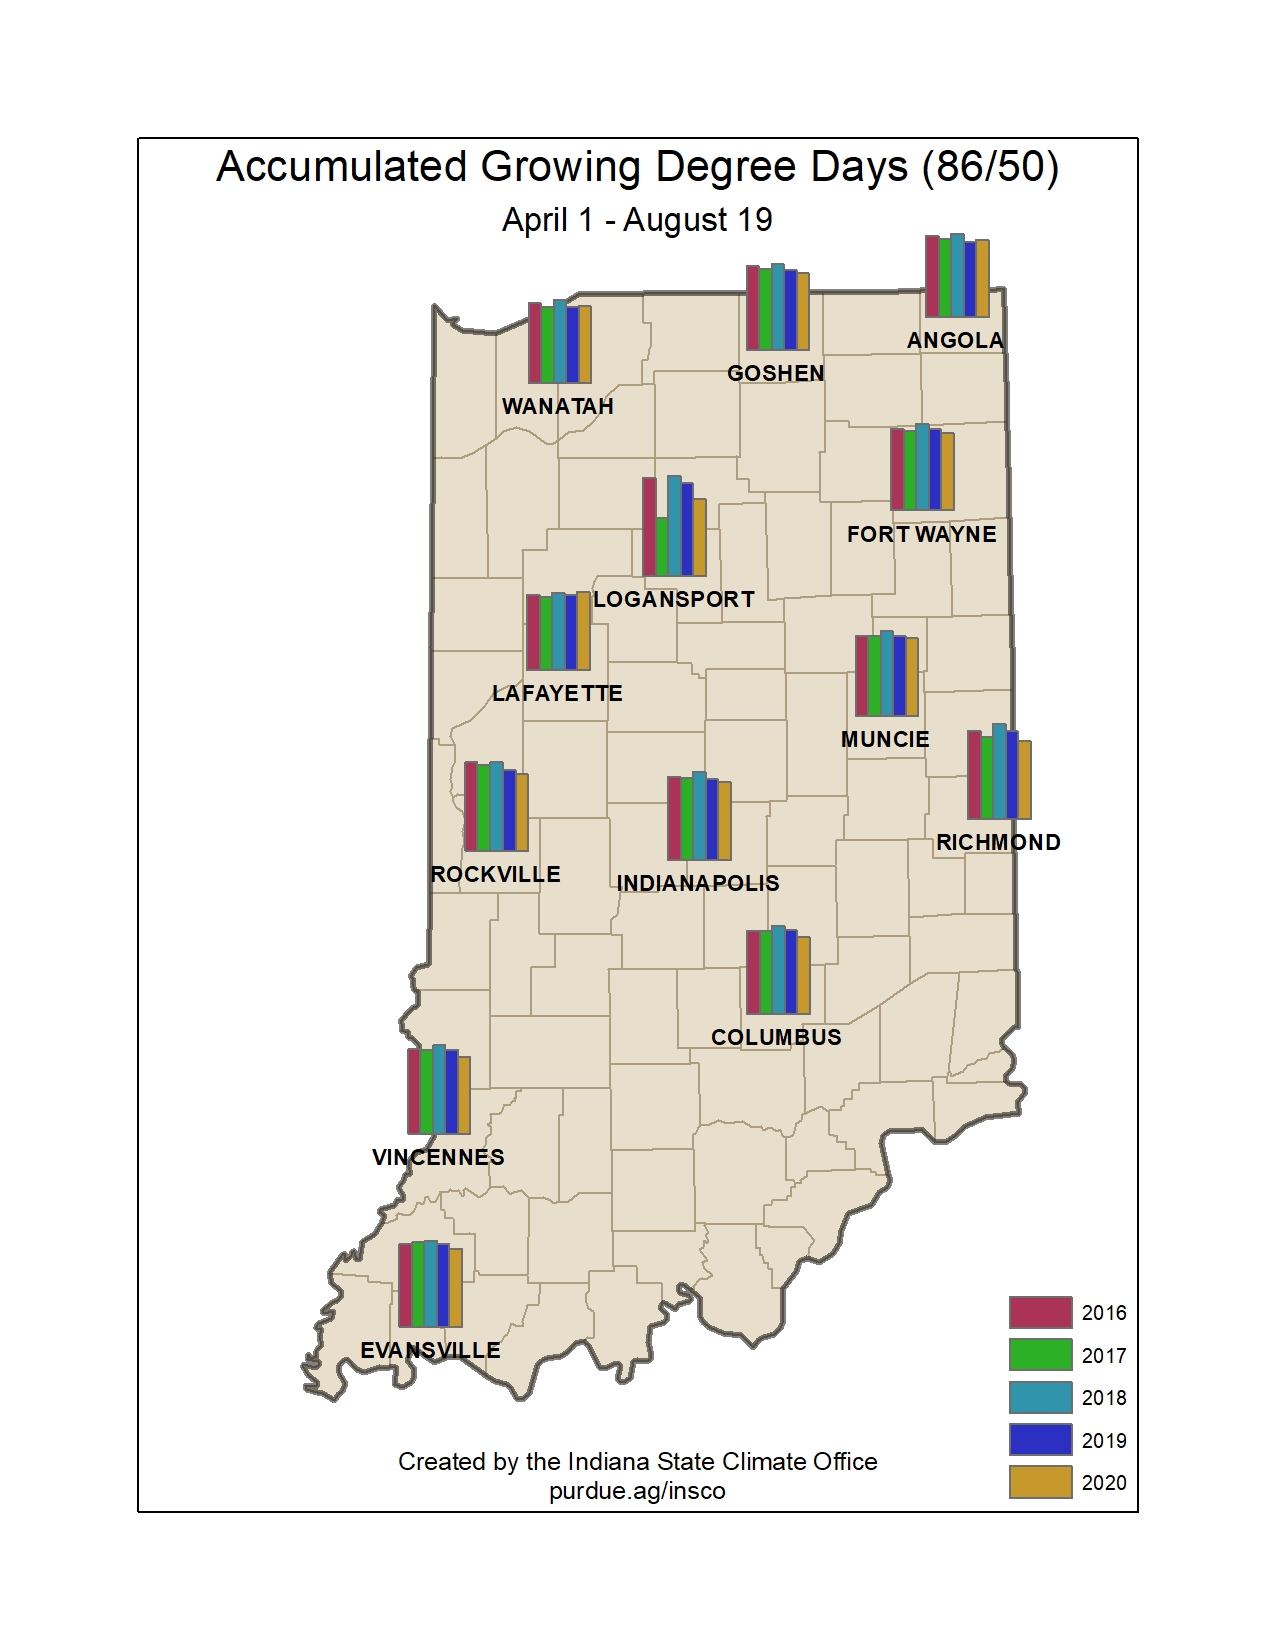
Figure 4. Comparison of accumulated modified growing degree days for April 1 through August 19 for 2016 through 2020
