

Indiana has been very dry the last several weeks (Figure 1) and conditions are starting to show in lawns and fields. This dryness has been exacerbated by low humidity and warmer temperatures (Figure 2). After a nice respite this past weekend, temperatures will start rising again into the weekend, but may not seem too uncomfortable with humidity remaining low at the front end of that warming period. The short-term forecast is calling for a slight chance of precipitation over the next seven days, but expect it to be light and spotty. The good news is the climate outlooks for the rest of June is showing increased probabilities of above normal precipitation (Figure 3), … but will it be enough to compensate for the deficit we have been facing these past few weeks? It is too early to know for sure, but there are no major storm systems on the horizon, nor jet stream patterns that indicate a lot of precipitation is on its way.
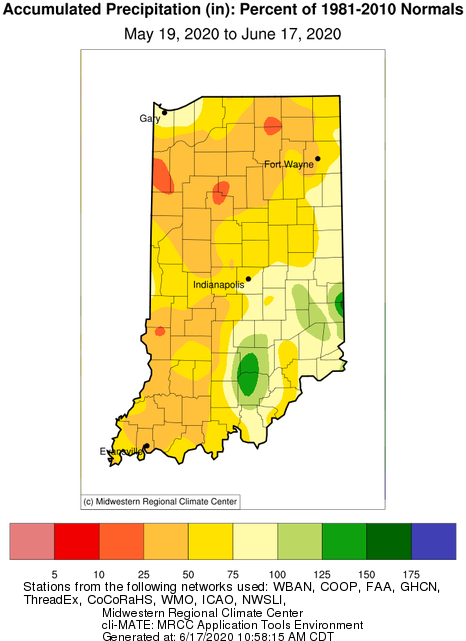
Figure 1. Accumulated precipitation from May 19 through June 17, 2020 presented as the percent of the 1981-2010 climate normal period.
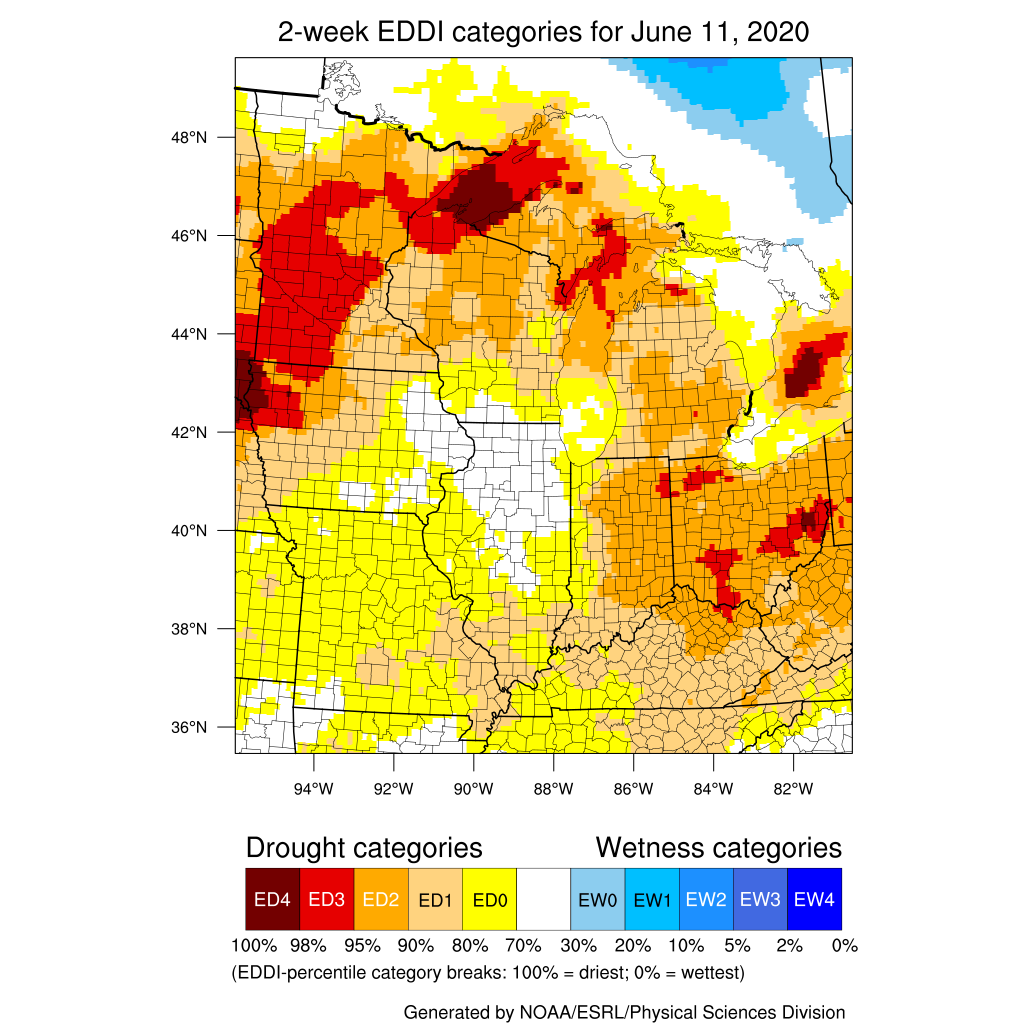
Figure 2. The Evaporative Drought Demand Index (EDDI) representing the level of modeled dryness based on recent precipitation, temperature, humidity, and other evapotranspiration factors. Period covers May 28 through June 11, 2020.
Figure 3. The 8-14-day climate outlook for precipitation representing June 24-30, 2020 where shading indicates the probability of above- or below-normal precipitation occurring during that time period.
Growing degree-day accumulations since April 1st (Figure 4) are still lagging about 30 to 120 units behind the climatological average, but there are signs that things are catching up in the northern part of the state (Figure 5).
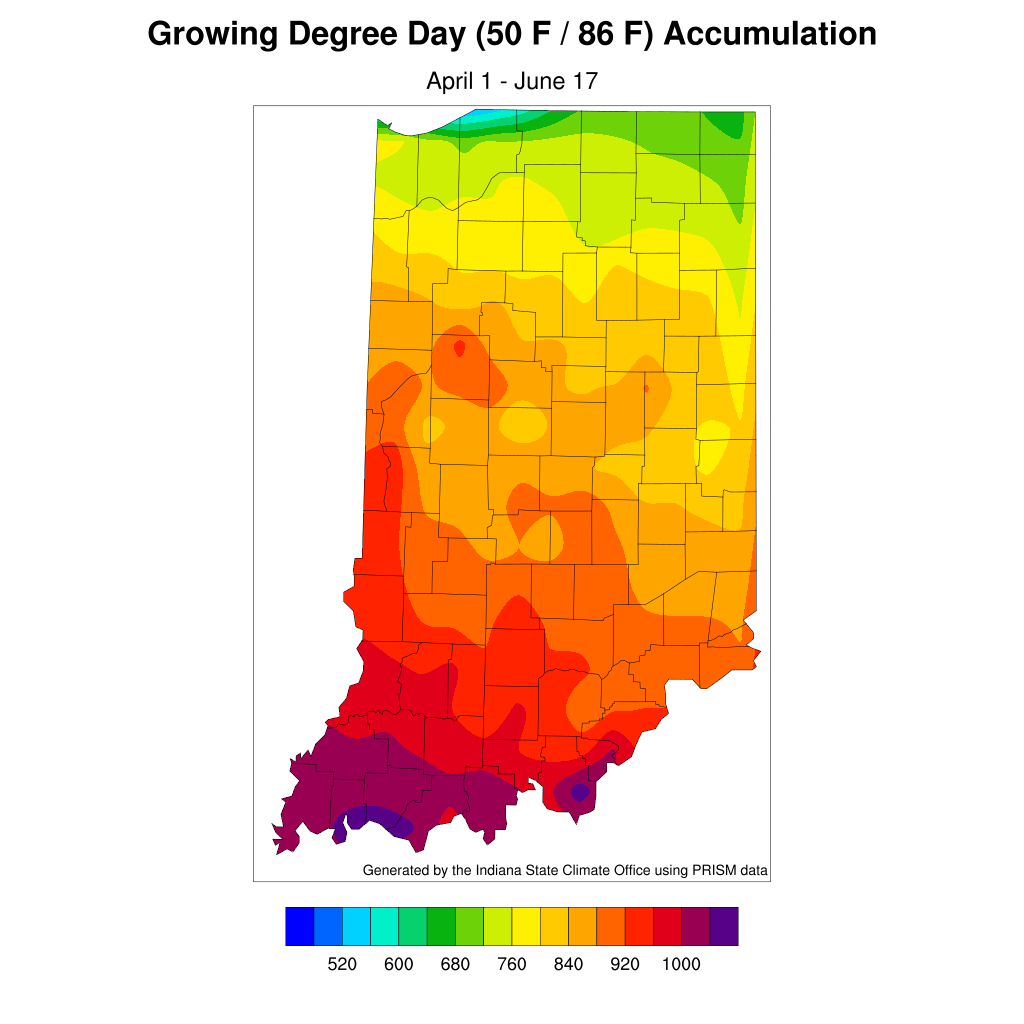
Figure 4. Modified growing degree-day accumulations since April 1, 2020.
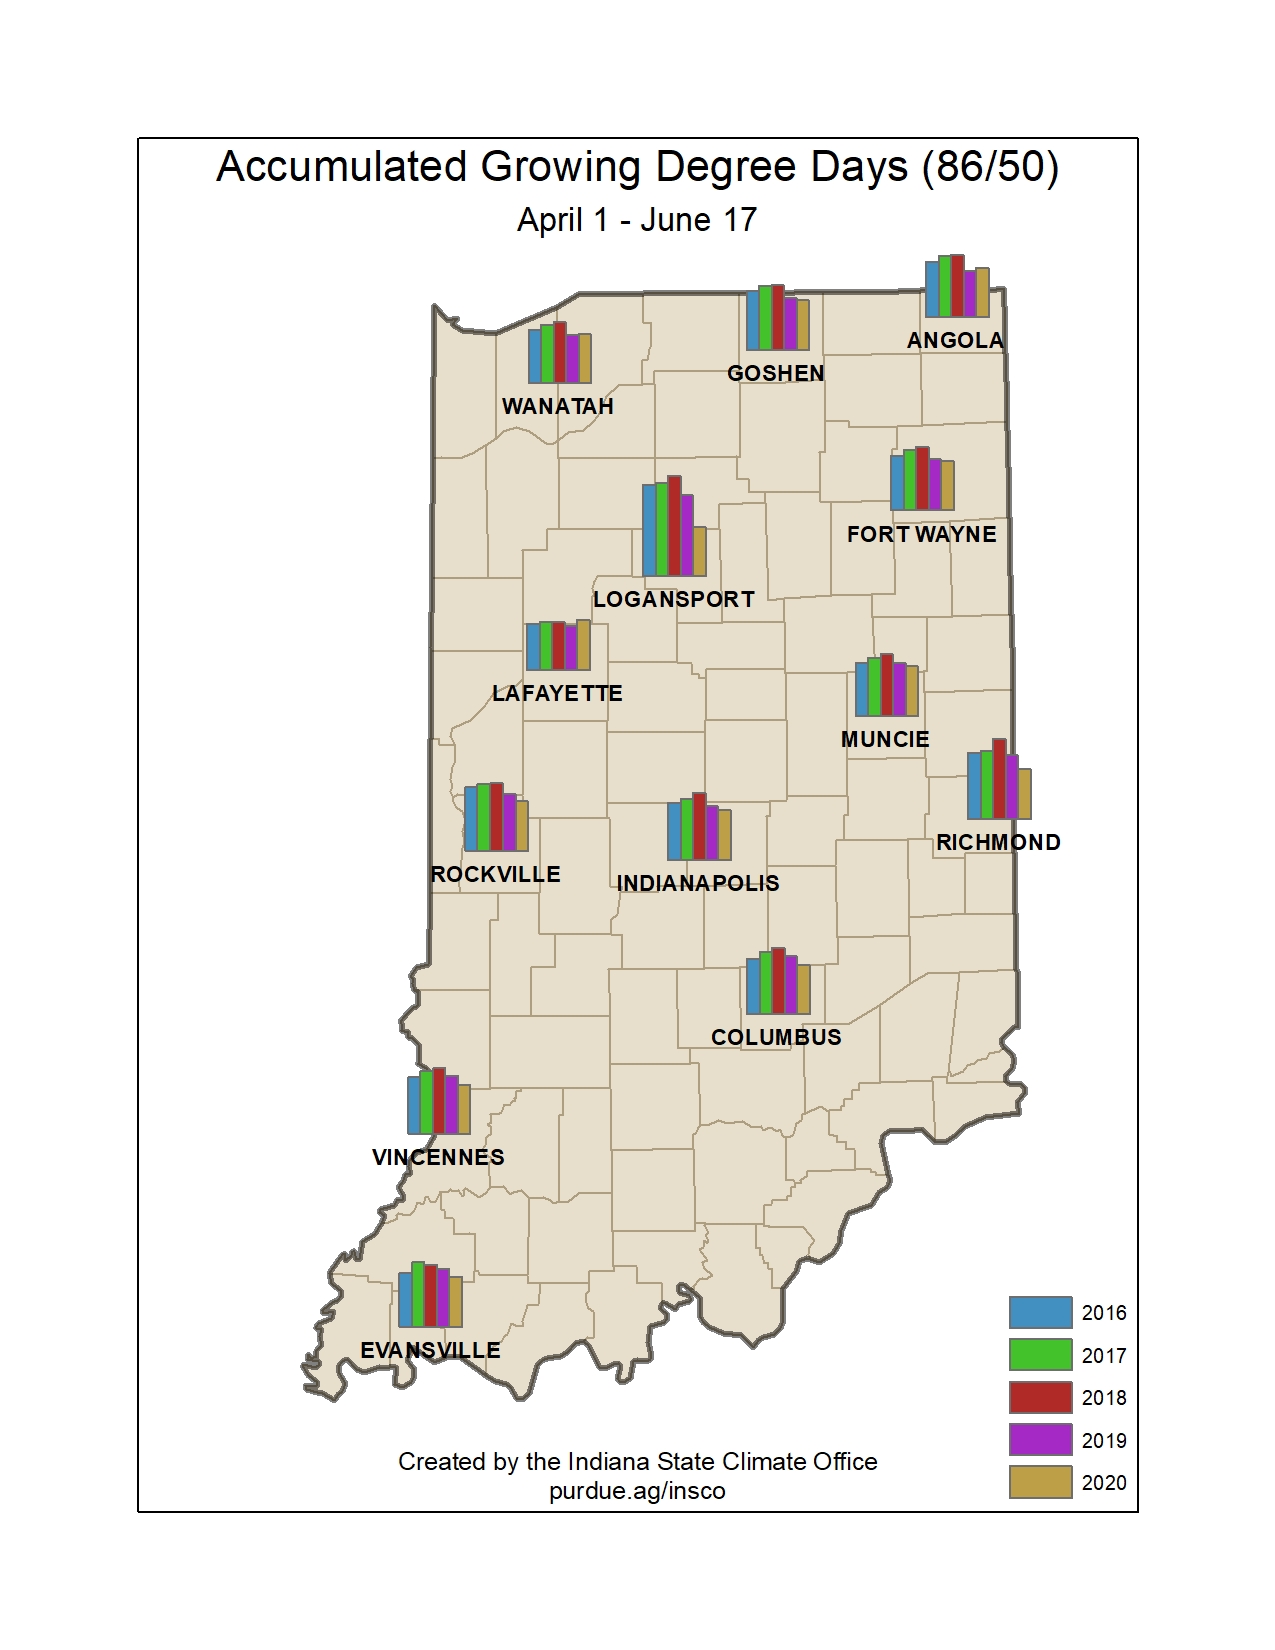
Figure 5. Comparison of modified accumulated growing degree-day accumulations since April 1st for the past 5 years.
