

Over the past 30 days, southern Indiana has received above-average precipitation which has caused some flooding and well-saturated fields. Northern Indiana has received near-normal precipitation, yet there are localized areas of pooled water. Snowfall across the state has been below normal throughout the entire season, mostly due to temperatures staying above freezing.
Growing degree days (base 50°F) have started to accumulate (Figure 1), which means plants are starting to emerge and green up. While this green up suggests warmer temperatures ahead, keep in mind that Indiana is still statistically likely to still experience at least one more hard frost. The average date of the last frost with temperatures 28°F or lower is between April 3-10 across most of the state (Figure 2).
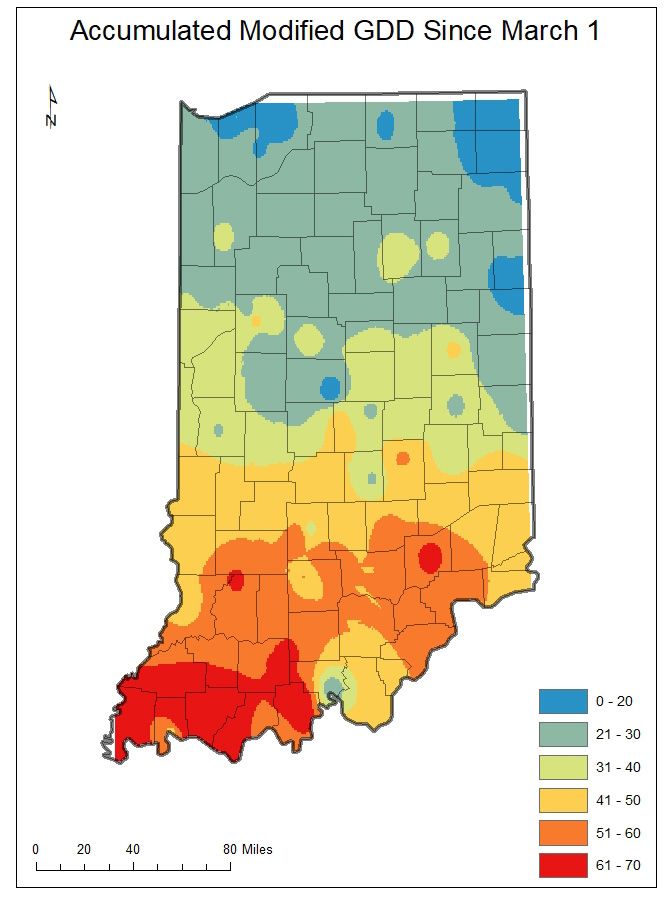
Figure 1. Accumulated modified growing degree days (base 50°F) since 2020 March 1 through 2020 March 24.
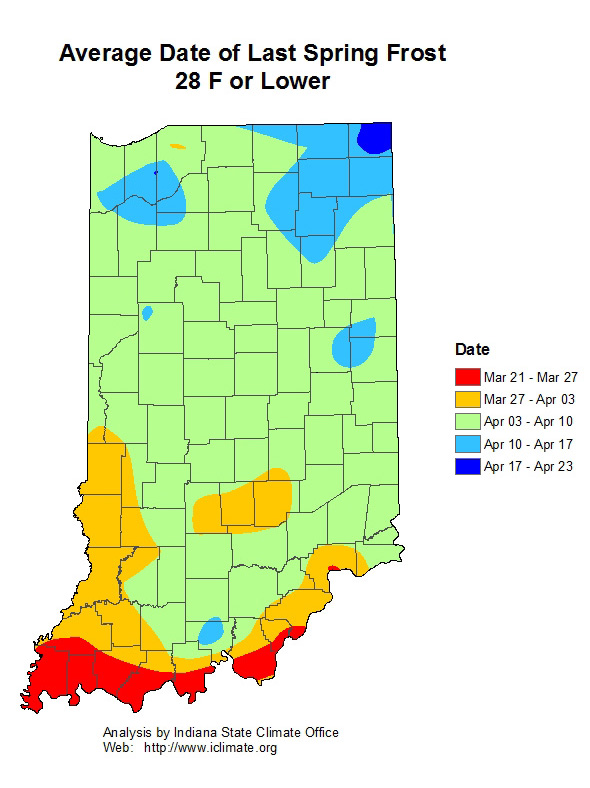
Figure 2. Average date of the last frost with temperatures at or below 28°F.
Speaking of temperature, the December 2019 – February 2020 three-month period ranked as one of the warmest over the past 125 years (1895-present) (Figure 3). Not only is this remarkable, but could suggest significant overwintering of many pests across the state!
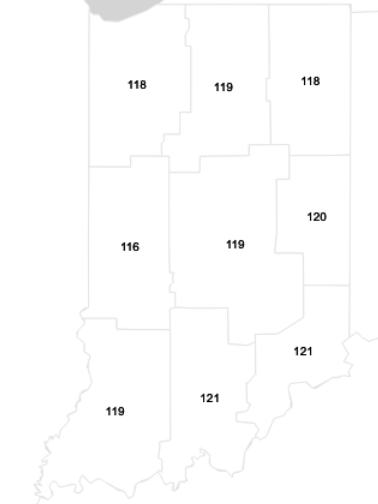
Figure 3. Climate division rankings of the December 2019 through February 2020 mean temperature compared to the 125-year climatology (1895-present). A rank value of 125 would indicate the warmest 3-month period on record. Therefore, these ranks indicate that for Indiana, this past meteorological winter ranked in the top 10 warmest years.
Climate outlooks for April 3rd through 9th are showing increased confidence of below-normal temperatures and precipitation (Figure 4). Assuming temperatures are not too below normal, this will hopefully help dry things out enough to be able to start preparing for the upcoming growing season! Unfortunately, the climate outlook for April is suggesting increased confidence of above-normal precipitation for the southern half of Indiana. At this time, however, those amounts do not appear to be as high as they were in 2019.
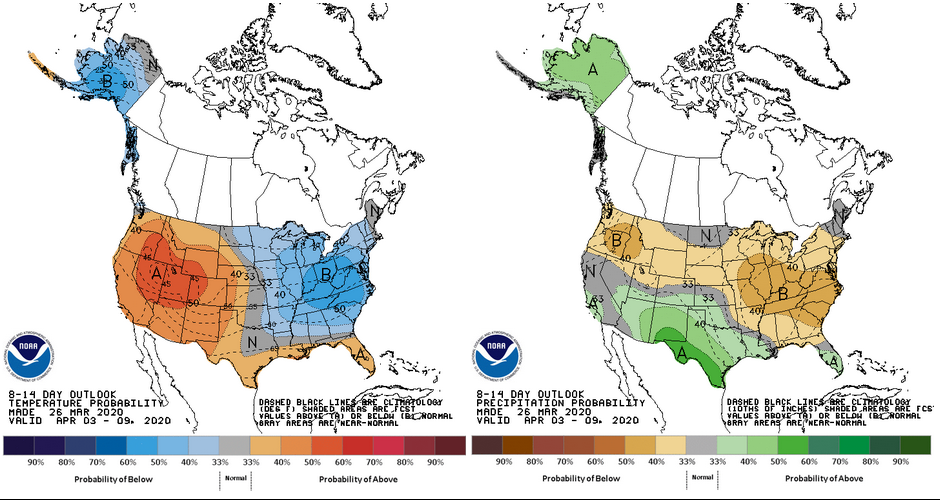
Figure 4. Climate outlooks for the 8- to 14-day period representing April 03-09, 2020. Temperature probabilities are displayed on the left; precipitation probabilities displayed on the right. The greater the probabilistic value, the greater the confidence that temperatures / precipitation amounts will be above / below normal – depending on the map and shading, respectively.
