Outlooks Showing Confidence For Below-Normal Precipitation

The roller coaster ride of Indiana weather continues.  Things were drying out across the state with signs of browning lawns, rolling vegetation leaves, and lowering pond and stream levels.  Then the rains came.  Most of the state received between 2 and 3 inches of precipitation from June 20 through 29th – with wetter areas to the south and drier areas to the northeast.  While this may seem good enough to relieve any concerns about drought developing, the temperatures have been high to encourage the evaporation of those wet surfaces.  As a result, the US Drought Monitor has kept most of the state at “Abnormally Dry”.  The climate outlook for July 8-14 shows increased confidence of below-normal precipitation with the possibility of this dryness continuing into mid-July.  Additionally, probabilities are significant that temperatures will be above normal – further exacerbating any dryness due to lack of rainfall.  The climate outlook for July – provided by the national Climate Prediction Center – is showing strong confidence for above normal temperatures, but uncertainty regarding precipitation (Figure 1).
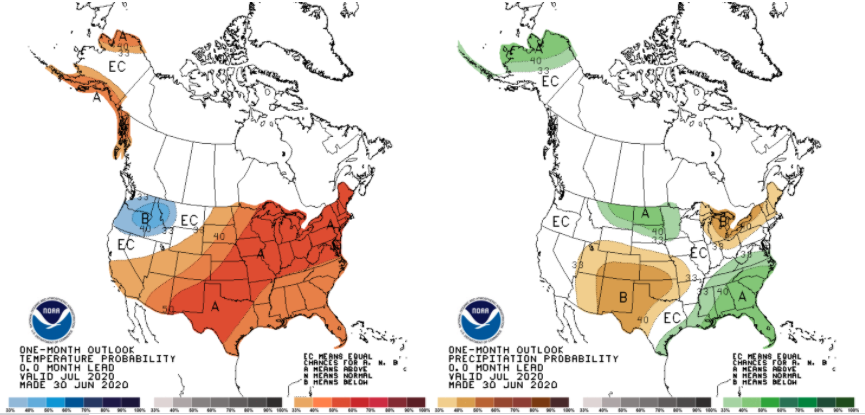
 

The 8-14-day climate outlook representing July 8-14, 2020 indicating the probability of temperature (left) and precipitation (right) being above or below normal.

The 8-14-day climate outlook representing July 8-14, 2020 indicating the probability of temperature (left) and precipitation (right) being above or below normal.


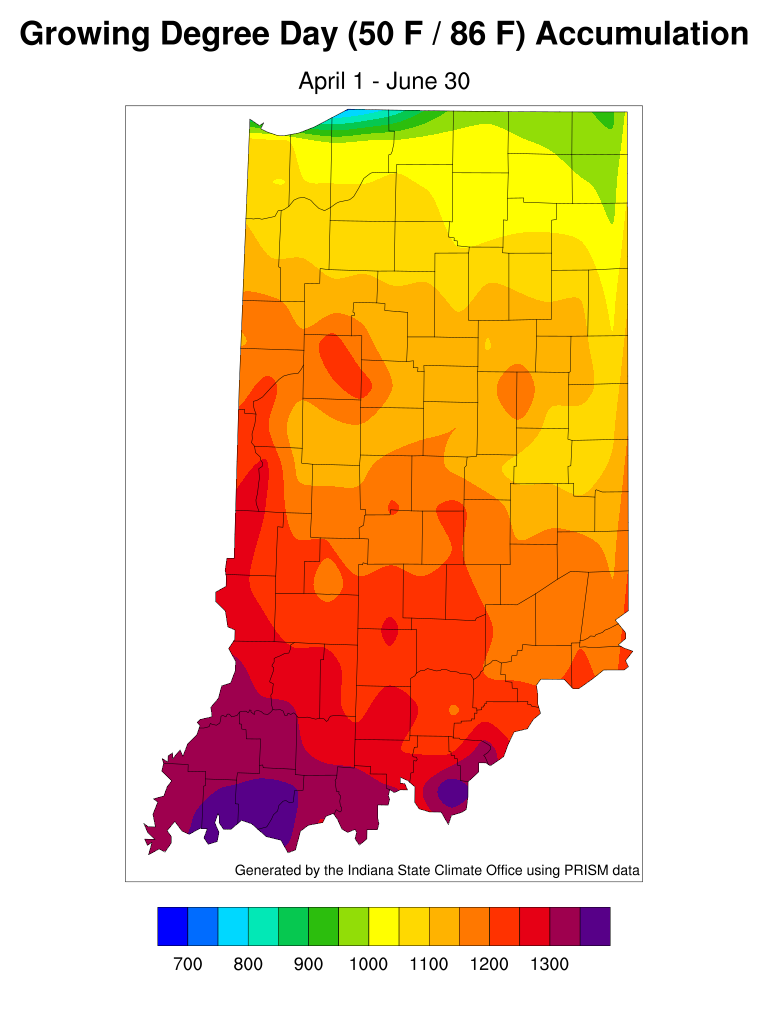
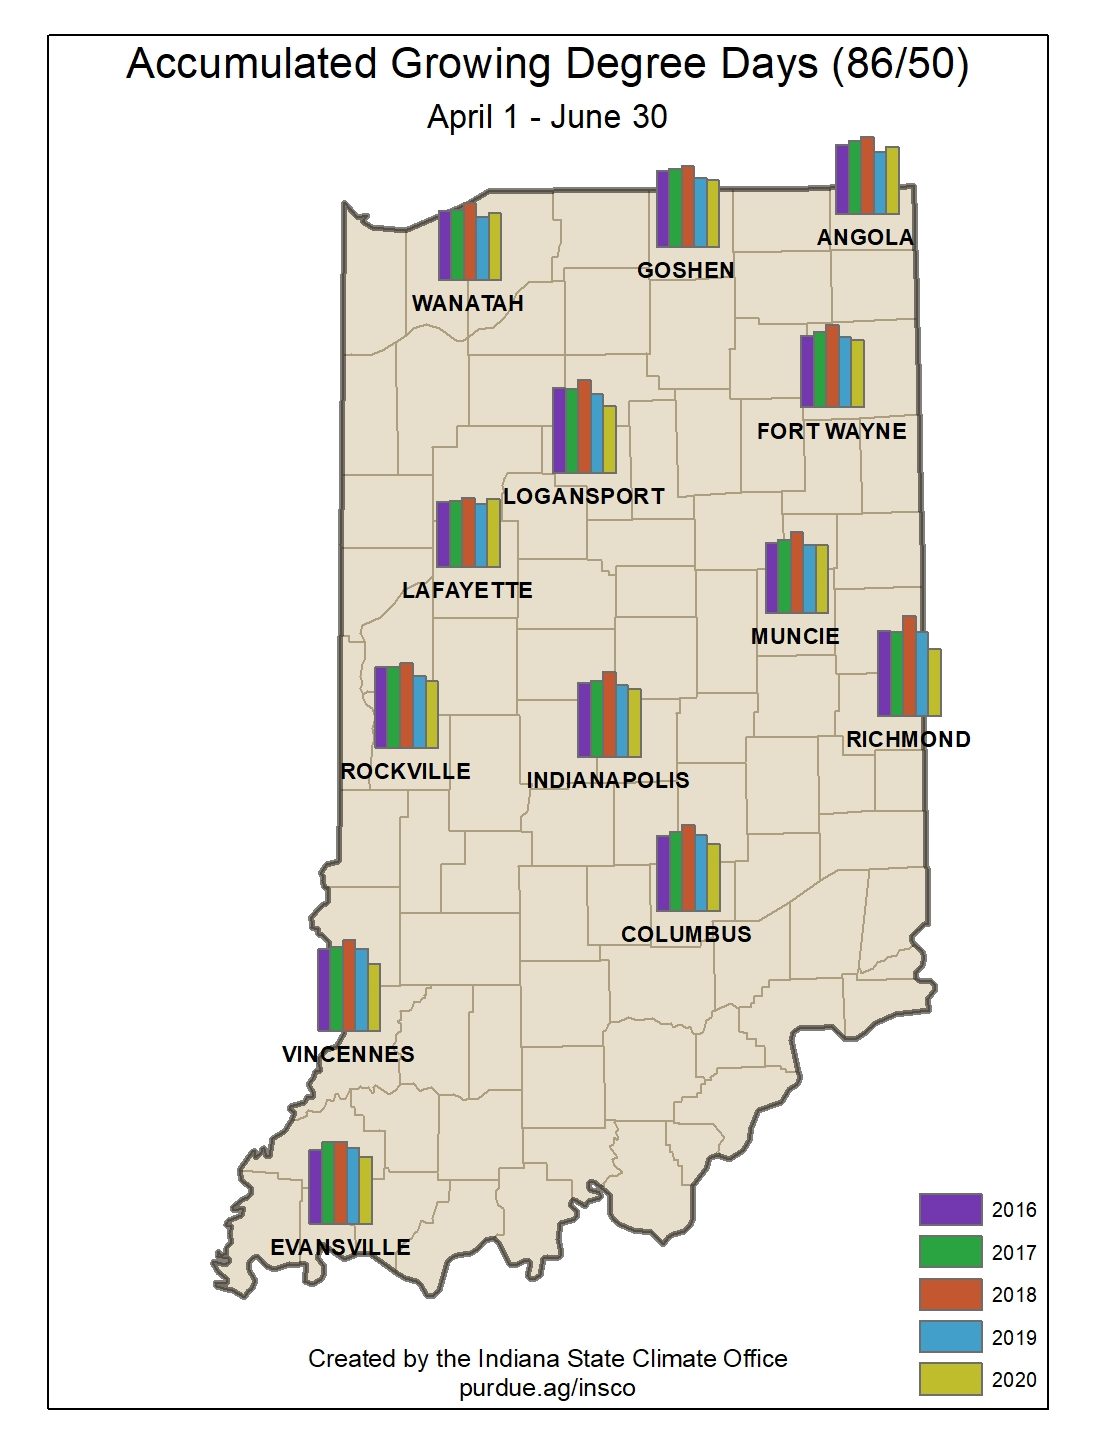
With temperatures continuing to be above normal, accumulated modified growing degree days continue to catch up to levels seen in previous years (Figures 2-3).  Beware of elevated heat index values that can increase health risks when working outside.  Learn more about how to stay safe during extreme heat and high heat index conditions from the Centers for Disease Control and Prevention.

Figure 2. Modified growing degree day accumulations since April 1, 2020.

Figure 2. Modified growing degree day accumulations since April 1, 2020.


Figure 3. Comparison of the 2020 accumulated modified growing degree days since April 1st to previous years.

Figure 3. Comparison of the 2020 accumulated modified growing degree days since April 1st to previous years.

Share This Article
It is the policy of the Purdue University that all persons have equal opportunity and access to its educational programs, services, activities, and facilities without regard to race, religion, color, sex, age, national origin or ancestry, marital status, parental status, sexual orientation, disability or status as a veteran. Purdue is an Affirmative Action Institution. This material may be available in alternative formats. 1-888-EXT-INFO Disclaimer: Reference to products in this publication is not intended to be an endorsement to the exclusion of others which may have similar uses. Any person using products listed in this publication assumes full responsibility for their use in accordance with current directions of the manufacturer.
Pest&Crop newsletter - Department of Entomology Purdue University 901 Mitch Daniels Blvd West Lafayette, IN 47907

© 2024 Purdue University | An equal access/equal opportunity university | Copyright Complaints | Maintained by Pest&Crop newsletter

If you have trouble accessing this page because of a disability, please contact Pest&Crop newsletter at luck@purdue.edu.