

Rain moved across Indiana earlier this week, bringing much-needed precipitation to the northern counties. Unfortunately, the 30-day rainfall totals for northern counties are still up to two inches below normal (Figure 1). The southern and southwestern counties are well above normal and could likely use a break for the next few days!

Figure 1. Precipitation departure from the 1981-2010 normals for the period July 13, 2020 to August 11, 2020.
Good news for those tiring of excessive heat conditions! Climatologically, the hottest day of the year (maximum temperature) is July 27th, so things should start to get cooler for the rest of the season. That does not mean cool and less humid conditions every day, but hopefully we can start putting most of those seasonally hot, humid days behind us! In fact, the climate outlooks through August 24th is showing slight confidence for below-normal temperatures (Figure 2). This same period is also predicted to have below-normal precipitation so perhaps things will get more comfortable without leading to abnormally dry conditions.
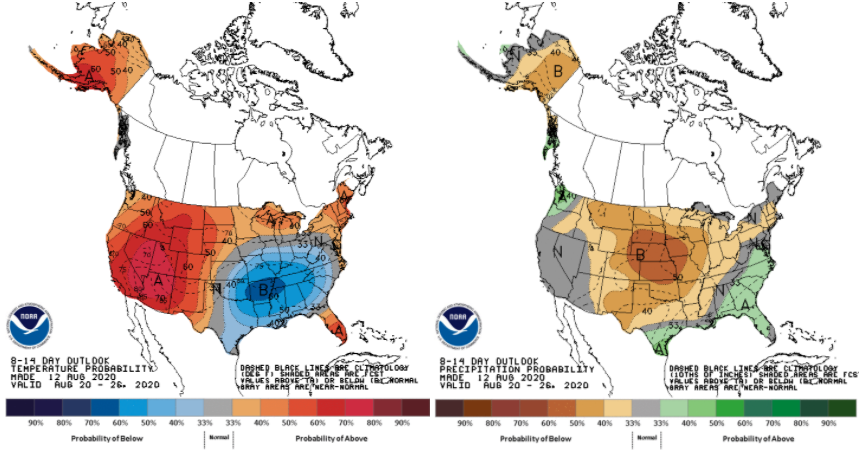
Figure 2. Probabilistic outlooks for above- or below-normal temperature (left) and precipitation (right) from the national Climate Prediction Center for August 20-26, 2020.
To help better monitor current evapotranspiration and precipitation conditions, the Indiana State Climate Office has launched a new tool (https://ag.purdue.edu/indiana-state-climate/tools/et-monitoring-tool/) that presents daily weather conditions in both tabular and graphical format for the nine weather stations across Indiana that comprise the Purdue Mesonet. When users first enter the site, they are presented with a map showing the station locations. Clicking on a map will then lead to a table of daily values. Accumulations for potential evapotranspiration (PET) and the Precipitation-minus-PET Deficit start with the default date, but users can modify the start date by using the slider tool at the top right of the page. Users can also view the data through time series graphs by clicking on the “Go to Graph View” (e.g., Figure 3).
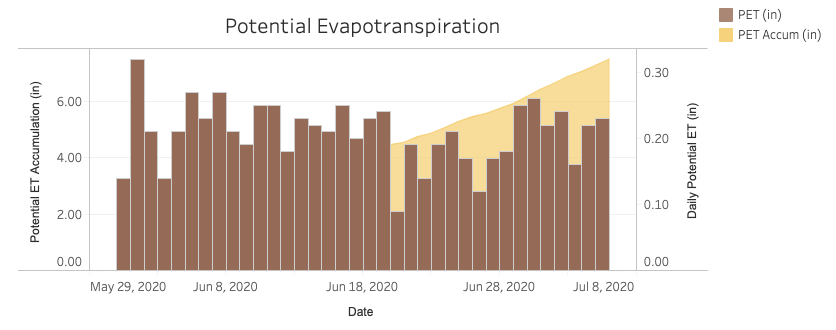
Figure 3. Sample graphical product from the Indiana State Climate Office’s Potential Evapotranspiration (PET) Monitoring Tool. This graph shows the daily PET (bars) along with the accumulated PET throughout the period of the graph (i.e., May 29, 2020 – July 8, 2020).
Accumulated modified growing degree days from April 1 through August 12, 2020 along with comparisons to recent years can be viewed in Figures 4 and 5.
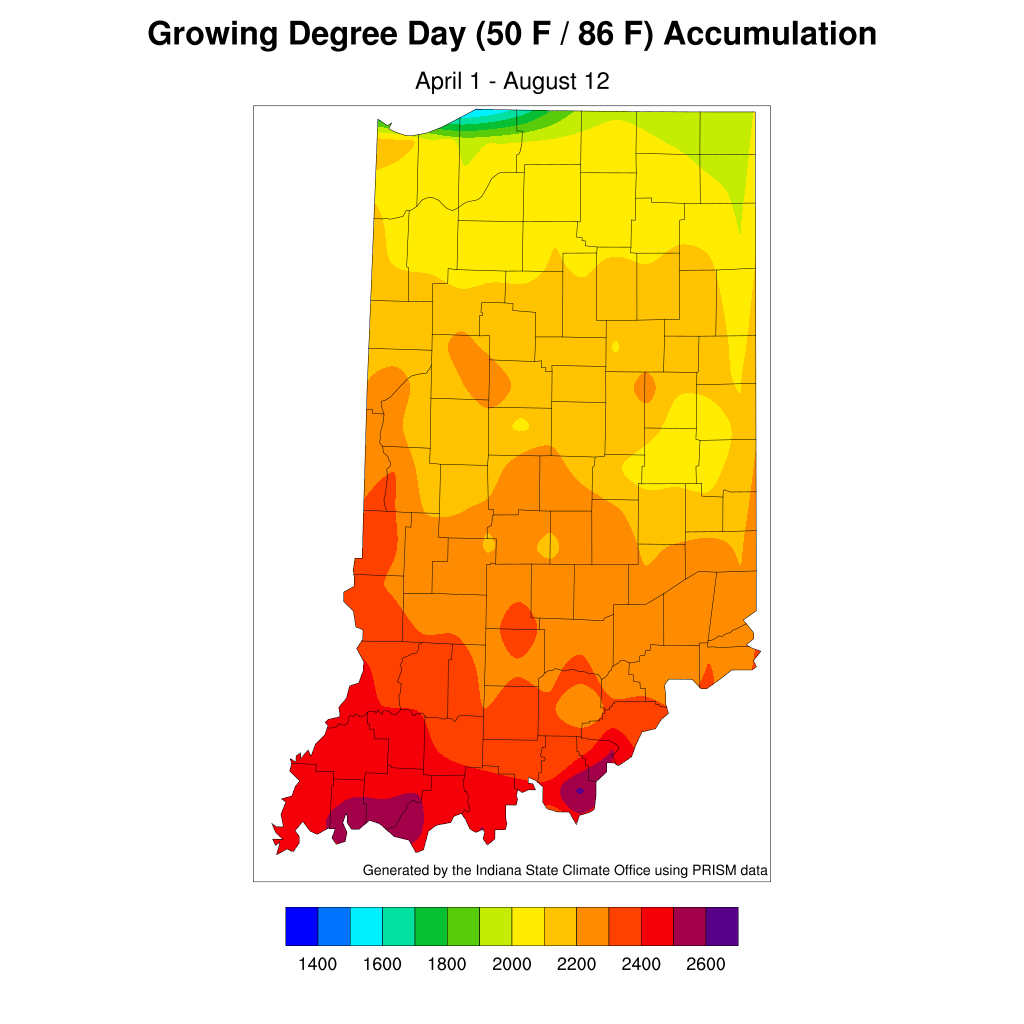
Figure 4. Modified accumulated growing degree-day units for April 1 – August 12, 2020.
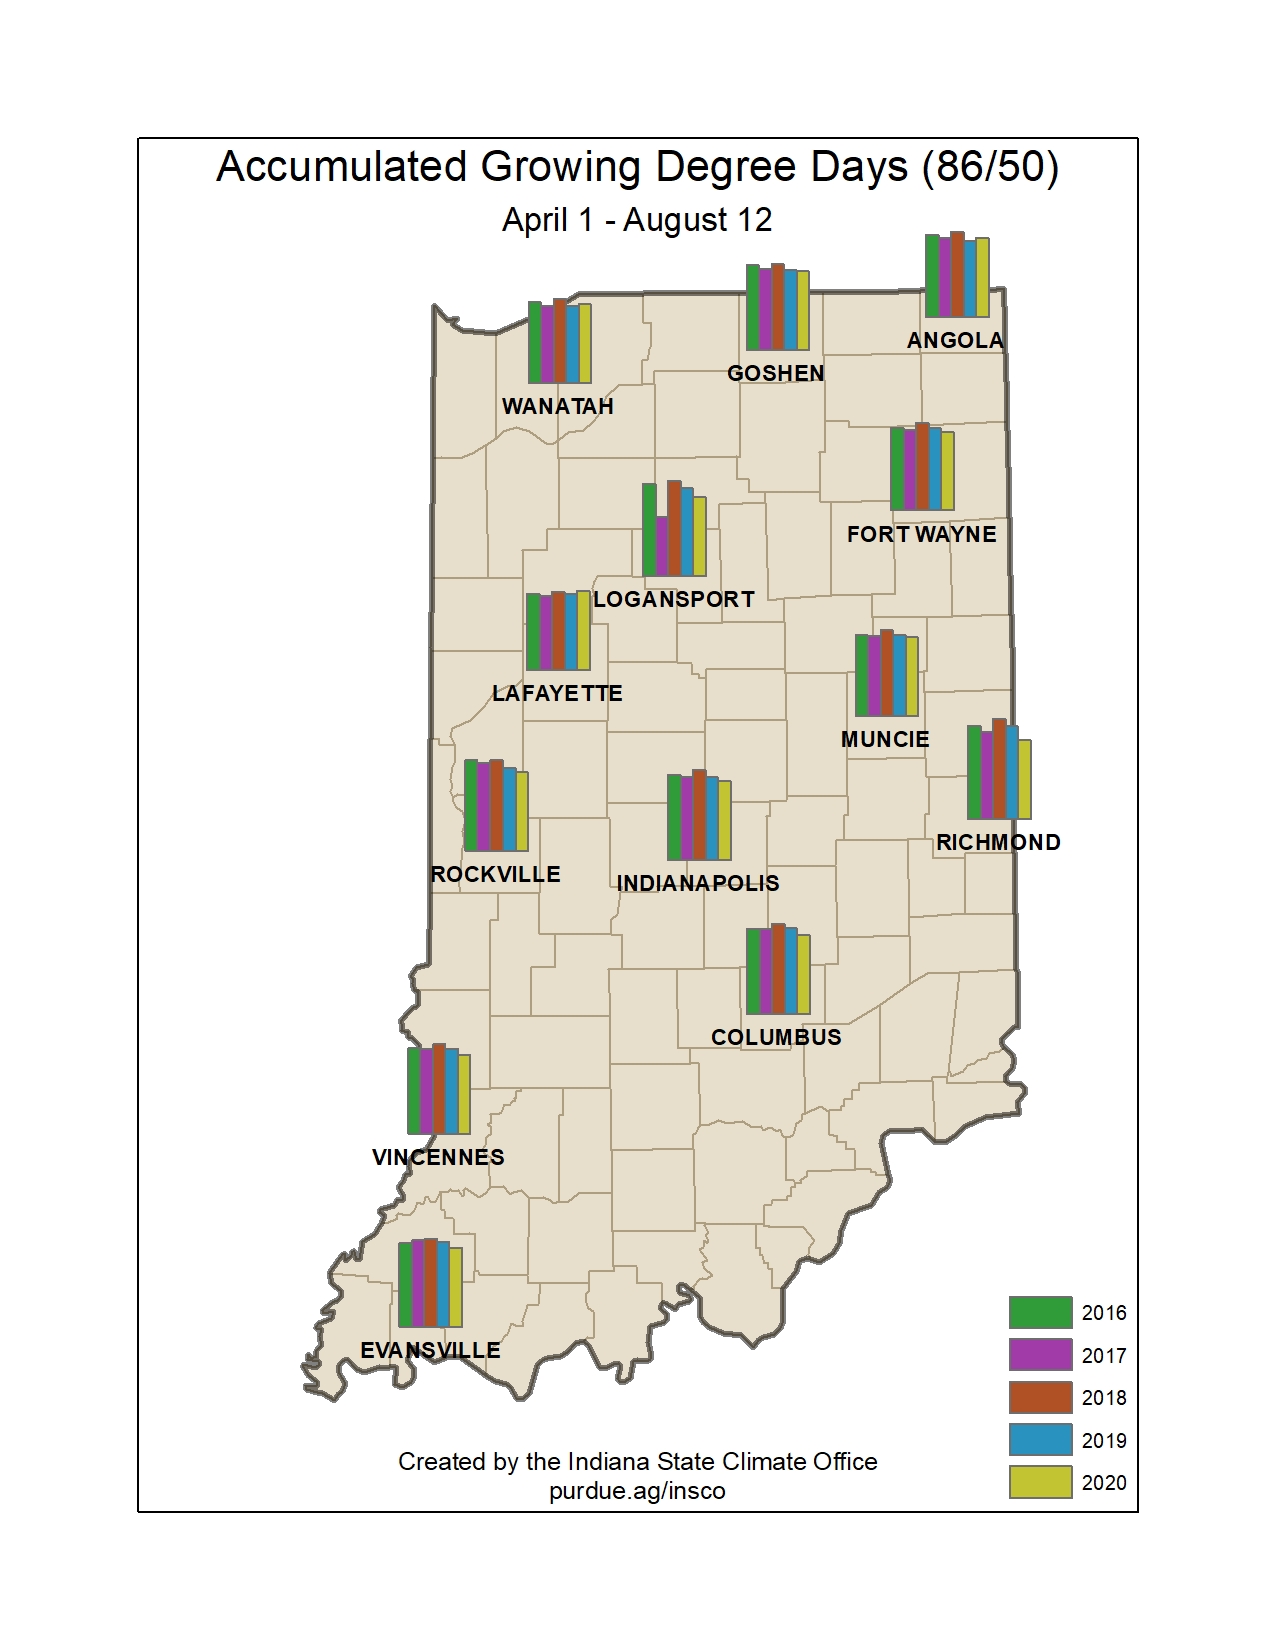
Figure 5. Comparison of accumulated modified growing degree days for April 1 through August 12 for 2016 through 2020.
