By late July, Indiana had settled into a typical midsummer pattern. Warm, humid days with warm overnight temperatures were common, and scattered thunderstorms left a patchwork of rainfall across the state. Extreme heat was brief, but the steady warmth kept crops progressing at a near-normal pace. Through July 28, accumulated MGDDs ranged from around 1,440 units in far northern Indiana to more than 2,080 units in the southern counties (Figure 1). Despite a cooler start to the growing season in May, July’s warmth allowed much of the state to catch up. Most locations accumulated between 75 and 125 percent of normal MGDDs, and crop development remained generally on schedule.
While daytime highs were only modestly above normal from July 1–28, persistently warm overnight lows were the primary driver of July’s above-normal temperatures. Average maximum temperatures were generally 1–4°F above normal across most of the state, while average minimum temperatures were even warmer, running 4–5°F above normal in many locations (Figure 2).
Rainfall depended largely on whether a thunderstorm happened to pass overhead. Rather than widespread soaking rain, July’s precipitation came primarily from scattered convective storms that produced sharp differences over relatively short distances. From July 1–28, precipitation totals ranged from less than an inch in parts of central Indiana to more than 6 inches in localized areas near the state’s northern and southern borders (Figure 3). A broad swath of central Indiana finished the period 2–4 inches below normal, while some locations near the state’s northern and southern edges ended the month several inches above normal. The contrast is well illustrated by Plymouth (Marshall County), which measured 9.98 inches of precipitation between July 1 and 28, more than 6 inches above normal. Meanwhile, Monrovia (Morgan County) received just 0.55 inches over the same period. The lack of widespread rainfall also allowed abnormally dry (D0) conditions to return to Indiana. As of the July 28 U.S. Drought Monitor, about 9 percent of the state was classified in D0 after Indiana had been free of all U.S. Drought Monitor categories at the end of June (Figure 4).
Rain remains in the forecast, although it is expected to fall primarily as scattered thunderstorms that will continue to benefit some areas while missing others. The Weather Prediction Center forecasts the greatest precipitation totals across north-central Indiana, where localized amounts of up to 2.5 inches are possible through August 5 (Figure 5). Looking further into August, the Climate Prediction Center favors above-normal temperatures during both the 6–10 day (August 3–7) and 8–14 day (August 5–11) outlook periods (Figures 6 and 7). During the same periods, precipitation outlooks favor near- to above-normal precipitation across much of Indiana. However, the scattered nature of summertime thunderstorms means rainfall totals are likely to remain highly variable from one location to another.
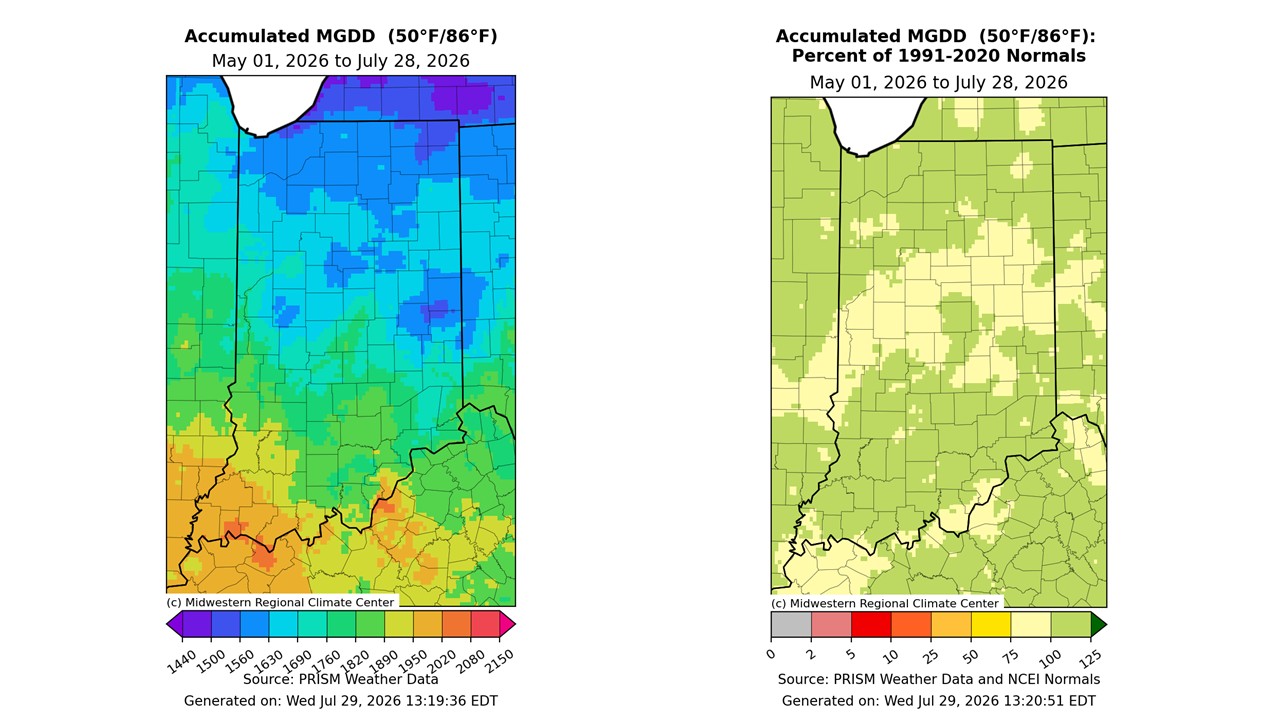
Figure 1. Left: Accumulated Modified Growing Degree Days (MGDD; 50°F/86°F), May 1–July 28, 2026. Right: Accumulated MGDDs for the same period expressed as a percentage of the 1991–2020 normal.
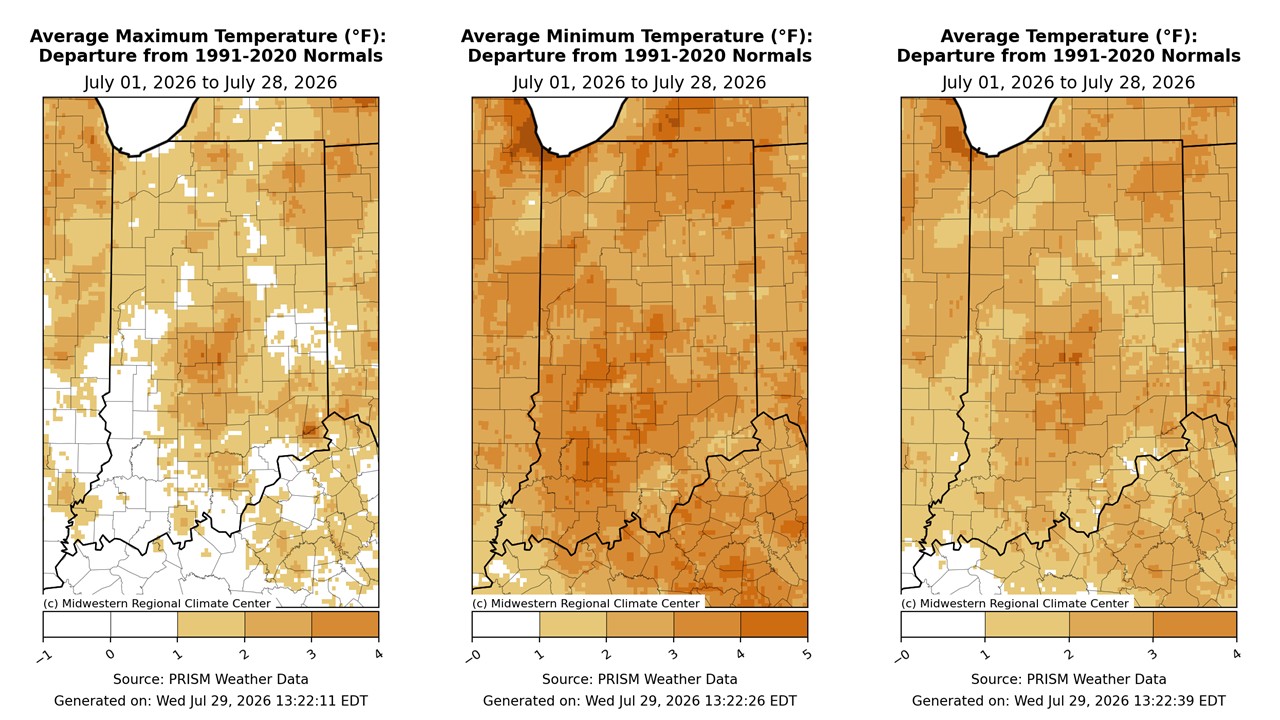
Figure 2. July 1–28, 2026, temperature departures across Indiana relative to the 1991–2020 normals (left: average maximum temperature; center: average minimum temperature; right: average temperature).
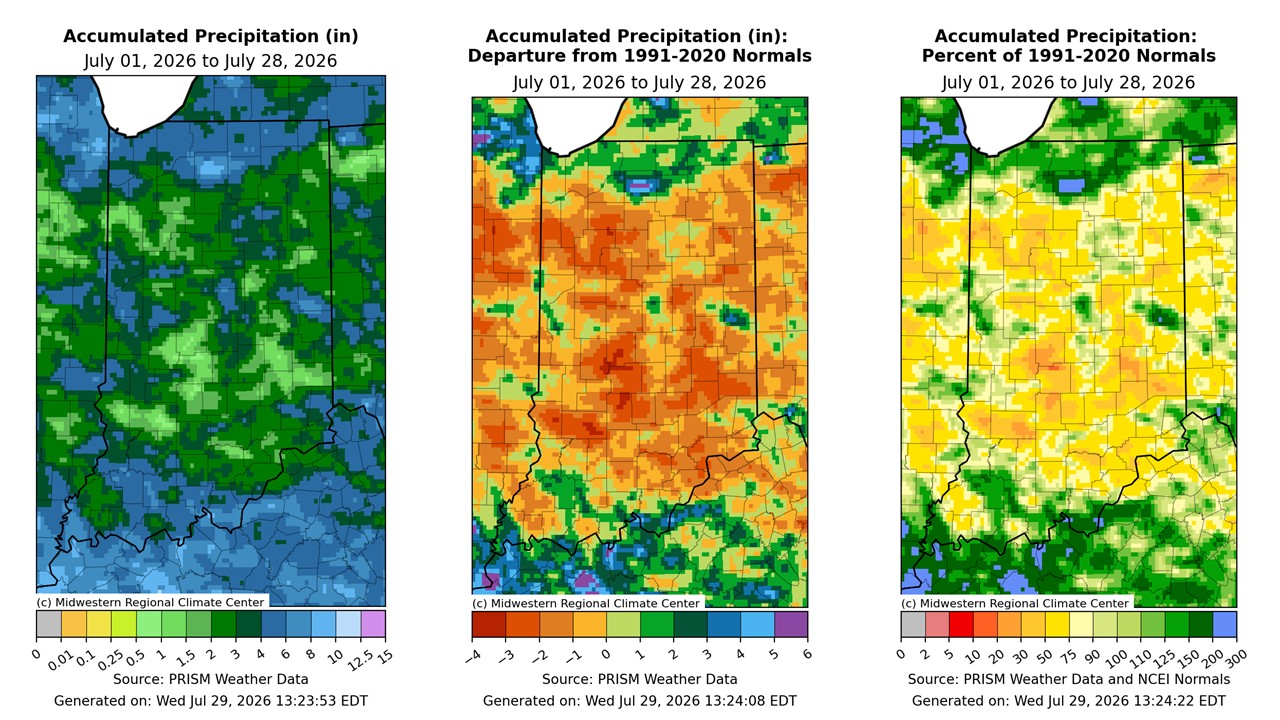
Figure 3. July 1-28, 2026, precipitation across Indiana (left: total precipitation accumulation; center: departure from 1991–2020 normals; right: percent of 1991–2020 normal precipitation).
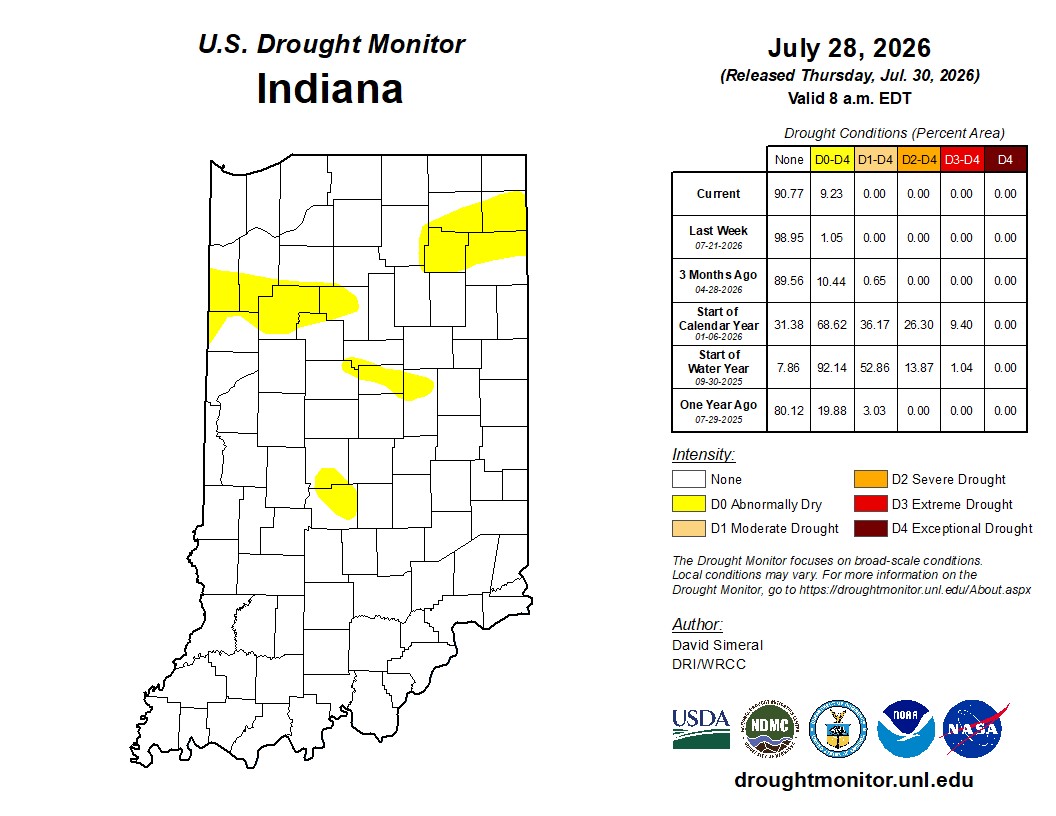
Figure 4. July 28, 2026 US Drought Monitor.
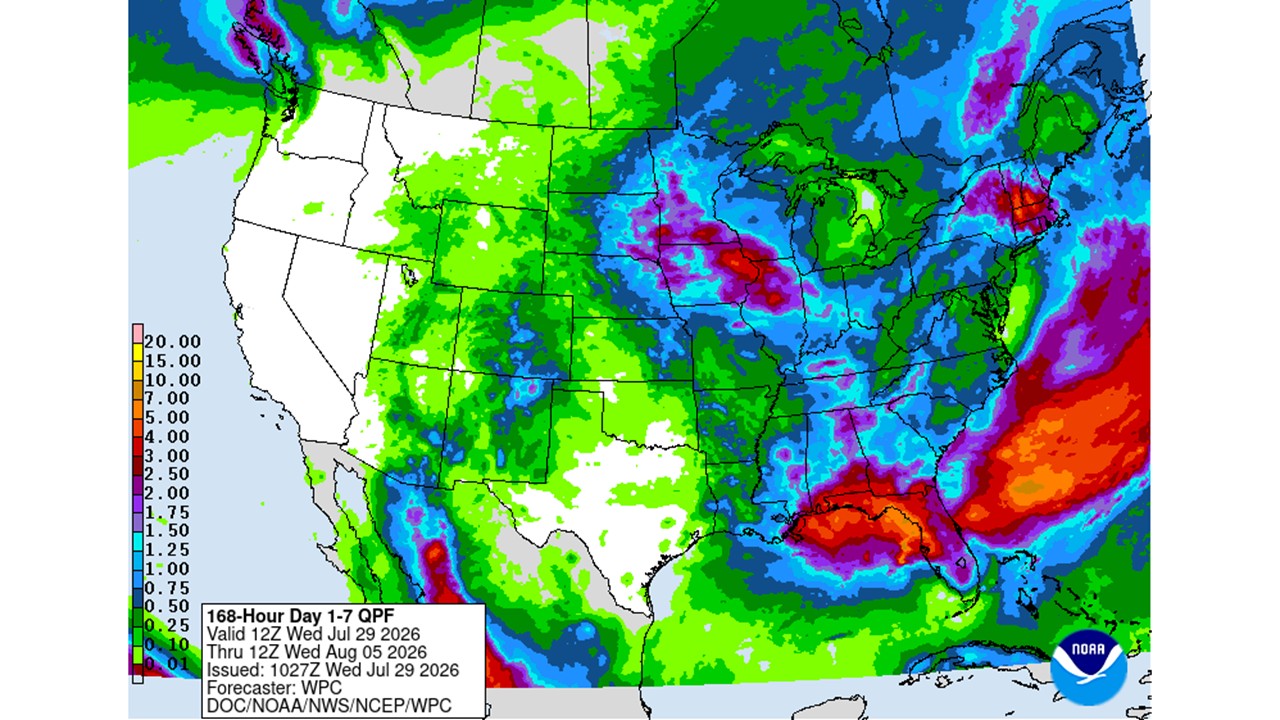
Figure 5. Weather Prediction Center Day 1–7 Quantitative Precipitation Forecast (QPF) showing forecast precipitation totals for July 29–August 5, 2026.
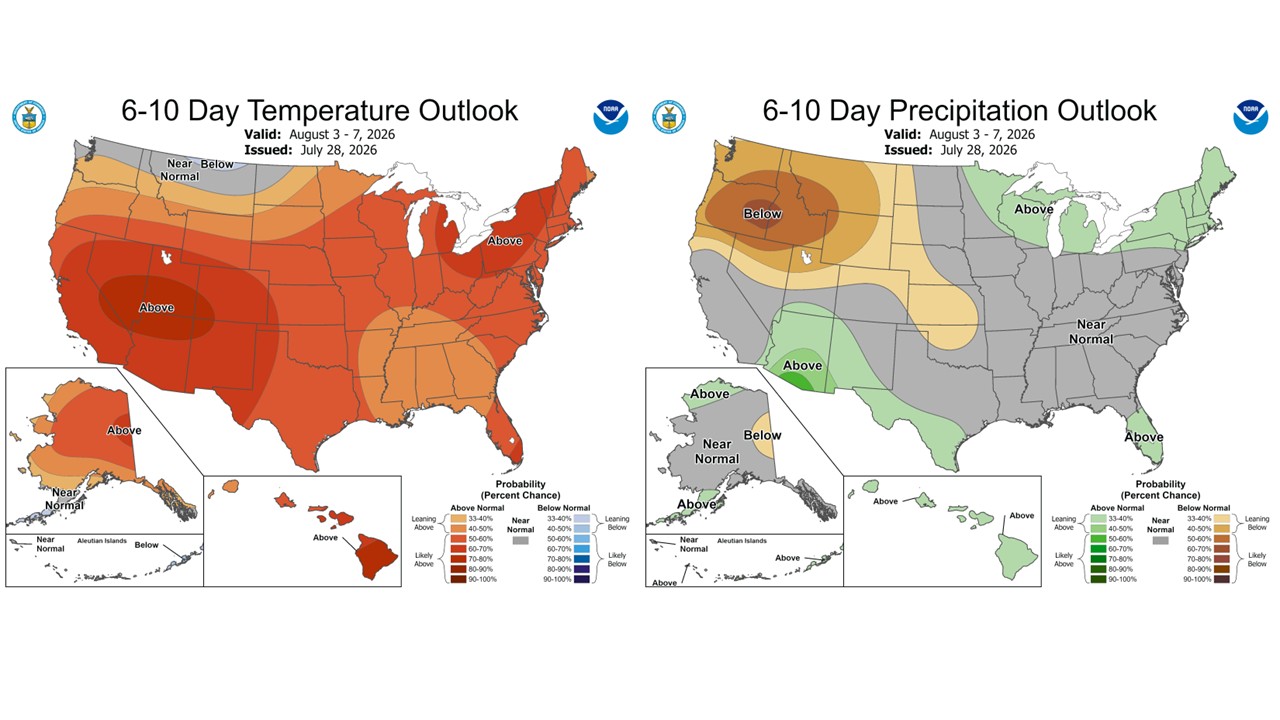
Figure 6. Climate Prediction Center 6–10 day temperature and precipitation outlook for August 3–7, 2026.
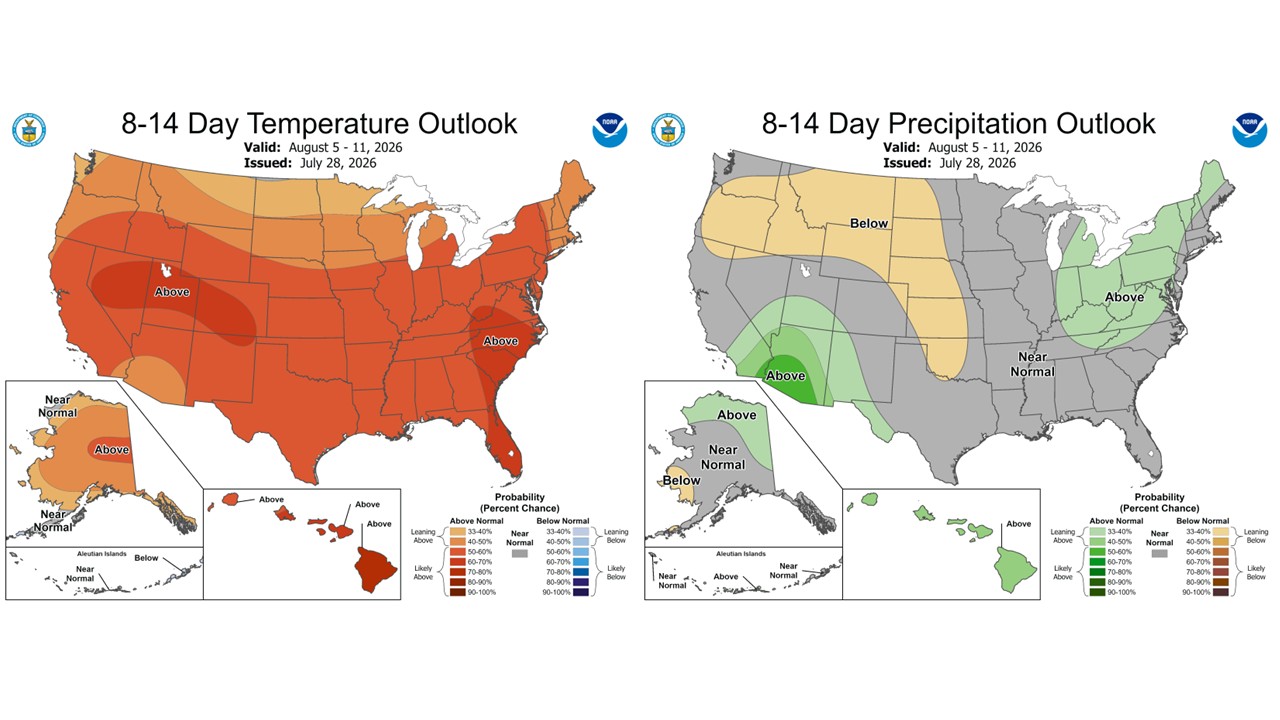
Figure 7. Climate Prediction Center 8–14 day temperature and precipitation outlook for August 5–11, 2026.