

The most recent U.S. Drought Monitor now has over 87 percent of Indiana in some level of dryness and/or drought (Figure 1). The rate this coverage has both expanded and intensified is impressive. Since at least 2012, drought specialists and climatologists have been studying “flash drought” including how to define it and therefore identify it. The original idea was based upon “flash floods” where flash drought develops quickly, rapidly intensifies compared to other droughts, and then tends to back off (i.e., weaken) relatively quickly. If you are ever in the mood to witness some rather animated – yet dry – debates about this, hang out with these climate scientists. Aside from the entertainment value, it is quite enlightening the many nuances associated with drought. A few highlights to the debate include: How fast is a “rapid onset” defined (e.g., 1 week, 1 month)? How is rapid intensification defined (e.g., 2-category change in the U.S. Drought Monitor within two weeks, 4-inch soil moisture depletion below a certain threshold within a defined period of time, rate of browning lawns?)? How do we define when a flash drought is over, even if long-term drought continues? Some consensus is developing, but there is a long way to go. For example, there is consensus that a rapid intensification of drought could occur amid an ongoing, long-term drought. Indicators used to determine a rapid intensification may differ throughout the U.S. Given how quickly the U.S. Drought Monitor’s drought levels have expanded and increased over the past few weeks across Indiana, there is good justification to say that the state is experiencing a rapid intensification of drought. Whether it is called a “flash drought” is yet to be determined.
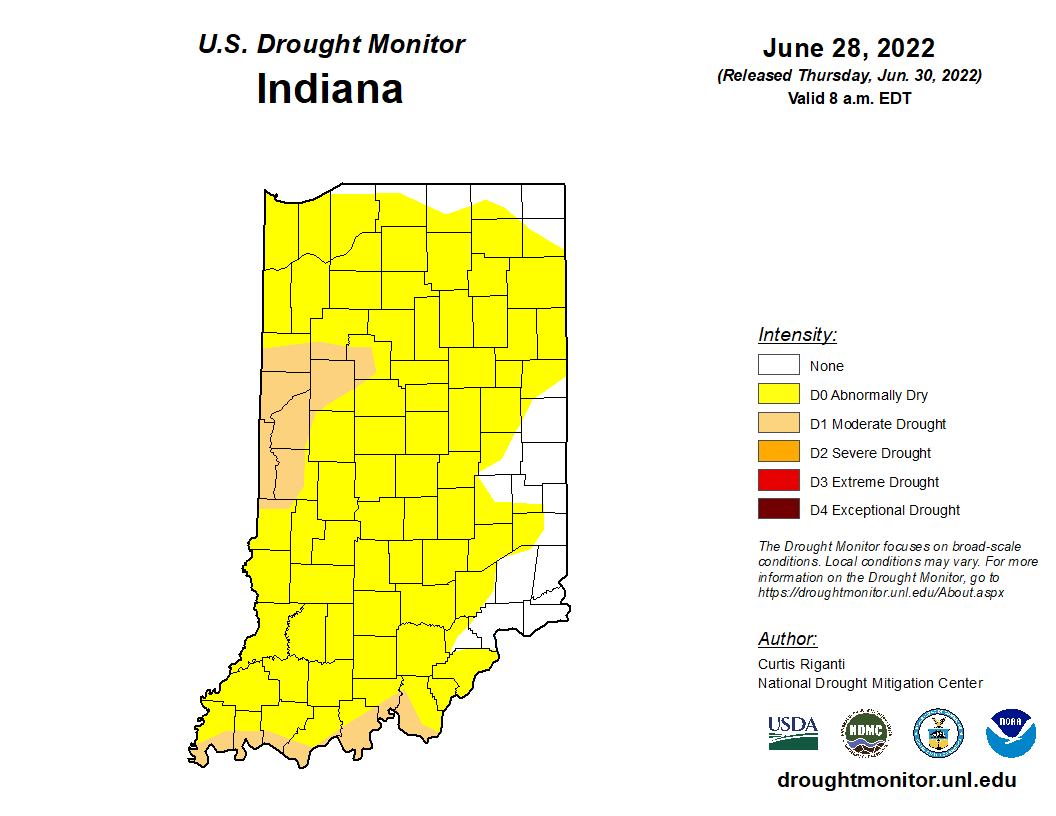
Figure 1. U.S. Drought Monitor for Indiana as of June 28, 2022.
Figure 2 illustrates how dry it has been in June. Thanks to the many weather stations and volunteer CoCoRaHS (cocorahs.org) observers across the state, the map shows where sub-county locations received less than 25 per cent of normal amounts for that period. Only far northeastern Indiana received above-normal precipitation for the month. The average temperature for June was near normal to slightly above normal (Figure 3). This may seem surprising given the extreme heat that was felt for several weeks. However, the important word in that sentence is “felt”, since it was the unusually high dew-point temperatures that make the apparent temperature – or heat index – so much higher.
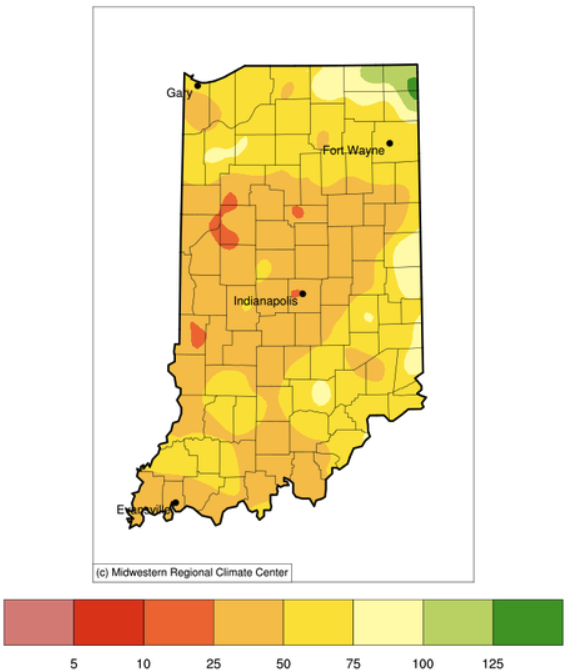
Figure 2. Precipitation from June 1-30, 2022 represented as the percent of what normally fell during that same period from 1991-2020.
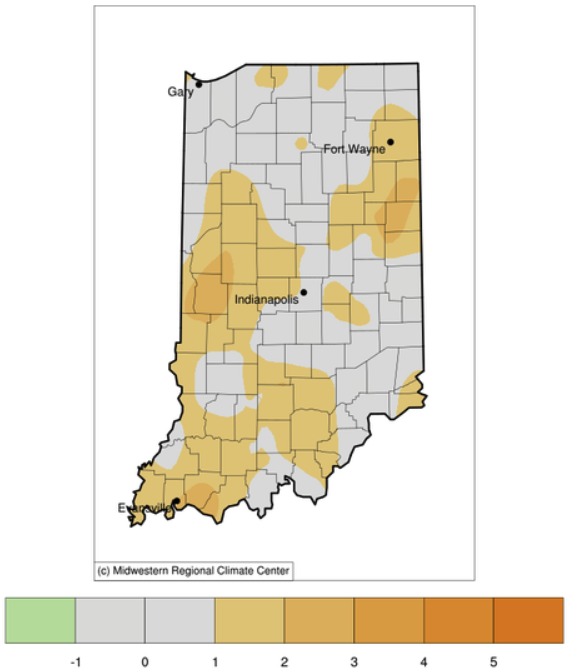
Figure 3. June temperature represented as the departure (in degrees Fahrenheit) from the 1991-2020 June average.
There is some good news in both the forecasts and the climate outlook. The National Weather Service is predicting around 0.5-1.5 inches of precipitation across the state through next Thursday, July 7, 2022 (Figure 4). There appears to be a bit of uncertainty and therefore confidence on when, where, and if this will happen, but if it does, it should provide some relief to these current conditions. The 8-to-14-day climate outlook (July 7-13, 2022) is favoring above-normal temperature with slight probabilities for above-normal precipitation. Finally, the climate outlook for July (released June 30, 2022) is continuing to favor above-normal temperatures with too much uncertainty about precipitation.
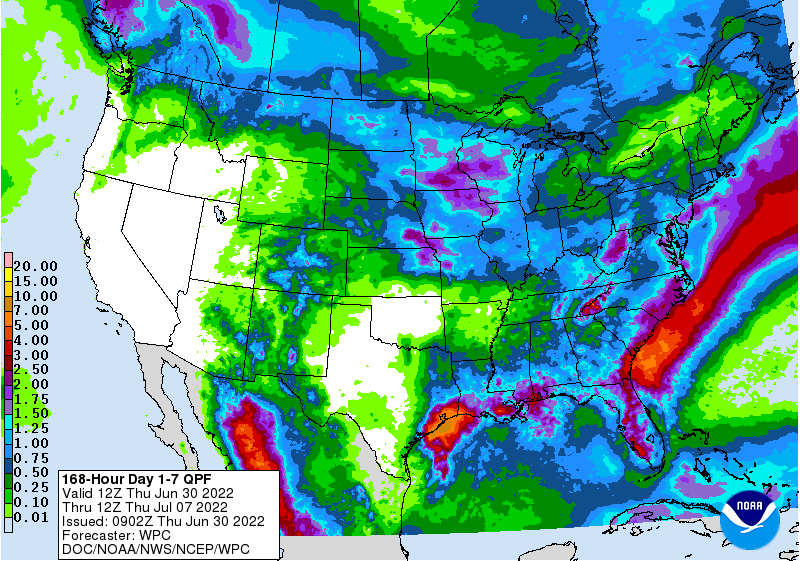
Figure 4. Forecasted precipitation amounts (inches) for June 30, 2022 through July 7, 2022.
Accumulated modified growing degree days, thanks to the higher-than-normal maximum daily temperatures experience in June, are 30 to 90 units above the climatological average in the southern two-thirds of Indiana with northern counties very near normal (Figures 5 and 6).
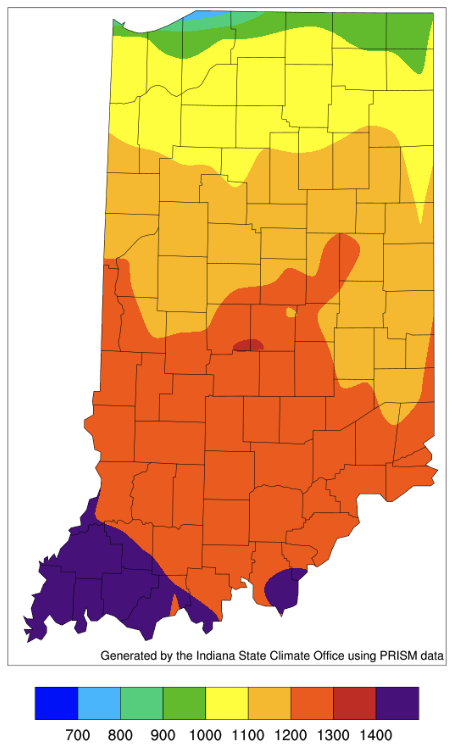
Figure 5. Modified growing degree day (50°F / 86°F) accumulation from April 15-June 29, 2022.

Figure 6. Modified growing degree day (50°F / 86°F) accumulation from April 15-June 29, 2022, represented as the departure from the 1991-2020 climatological average.
