

The last several weeks have seen very little precipitation across Indiana. Figure 1 illustrates how much was received compared to the climatological normal amount from May 9 through June 7. The entire state received amounts less than normal (where normal would be 100 percent on the map) with central and northeastern Indiana having received less than 25 percent of normal amounts. This has resulted in browning lawns, lowered ponds and streams, and most vegetation starting to look stressed. Why is this happening and how long will it last?
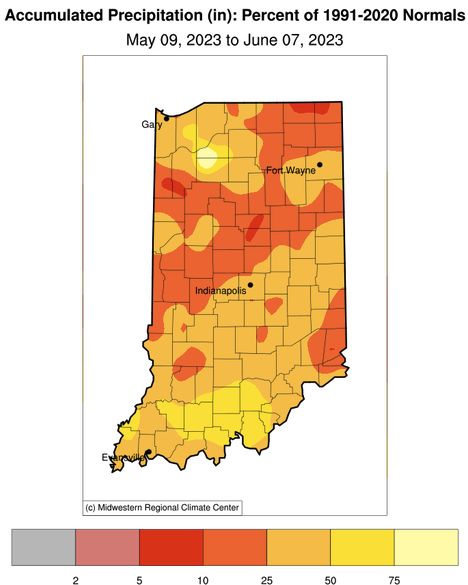
Figure 1. Precipitation from May 9 – June 7, 2023 represented as the percent of what normally fell during that same period from 1991-2020.
While the El Niño – Southern Oscillation (ENSO) global teleconnection pattern is shifting from the La Niña phase (that has been around for the better part of three years, now) to the El Niño phase, it is difficult to attribute this dryness to ENSO. Historically, ENSO phases have had weaker correlations to temperature and precipitation in the Midwest – particularly in the transition seasons of spring and fall. However, atmospheric patterns are shifting and so the Midwest has been the host of a high-pressure system that has effectively been blocking major storm systems from pass through the area. We can thank this high-pressure system for the smokey skies from the Canadian fires, and states south of Indiana can thank the high-pressure system for keeping them relatively wet. That high pressure system has not been all bad for Indiana, though. It has kept humidity low and winds rather calm. Being outdoors has seemed far more pleasant these past few weeks than typical for this time of year! Unfortunately, those lower humidity values and clear skies have also encouraged higher evapotranspiration rates, further drying things out.
As soon as that high pressure can get pushed out of the region, there is a chance that precipitation (and higher humidity) will return. That is indeed what the forecasts and climate outlooks are calling for! Current forecasts are predicting one to two inches of precipitation over the next 7 days (Figure 2). The historical average (1991-2020) for that same period from June 8 through June 15 is between 1.0 and 1.75 inches across Indiana. In other words, precipitation should be returning to our area and in amounts that are typical for this time of year. As one looks beyond June 15th, the climate outlooks are favoring above-normal temperatures with near normal precipitation. While this may not make up for the lack of precipitation seen over the past several weeks, it should provide some hope that the current abnormally dry and moderate drought conditions should not worsen. At least for a while.
Figure 2. Forecasted precipitation amounts (inches) for June 8 through June 15, 2023.
The most recent U.S. Drought Monitor illustrate how drought conditions across much of Indiana have worsened over the past week (Figure 3). Except for a few counties in far southern Indiana, the rest of the state has either been categorized as Abnormally Dry (D0) or in Moderate Drought (D1). Because of this continued deterioration over the past several weeks, one may start referring to this as a “flash drought”. There are many definitions of “flash drought” but one of them is to have a rapid onset of drought intensification over a short period of time (e.g., 2-3 weeks) and then sustain those intensely dry conditions for several more weeks. One could argue that we have met the first condition. Will we meet the second condition? Let us hope those optimistic forecasts and climate outlooks are correct and we can all breathe a sigh of relief that we do not.
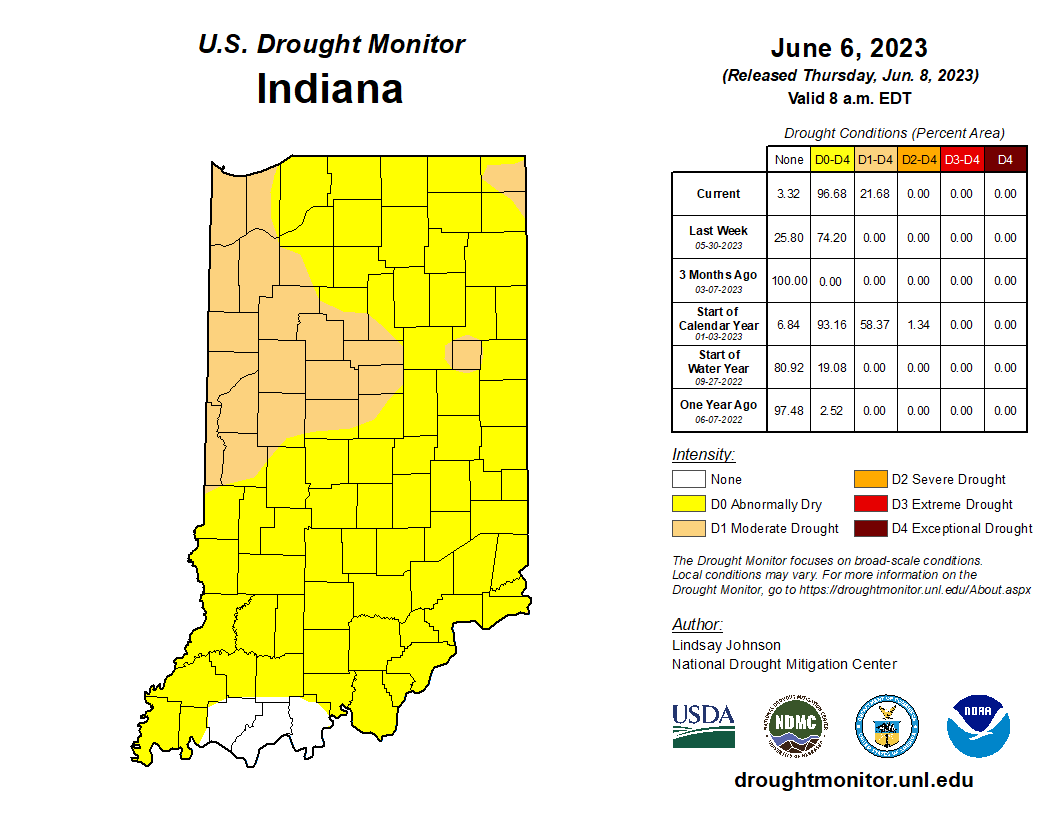
Figure 3. U.S. Drought Monitor for Indiana as of June 6, 2022. Source: https://droughtmonitor.unl.edu/CurrentMap/StateDroughtMonitor.aspx?IN
Modified growing degree-day (MGDD) accumulations have been moving along nicely across Indiana since April 1st. Figures 4 and 5 show the actual accumulations and departure from normal, respectively. Northwestern into central Indiana has accumulated more MGDDs than normal whereas areas along the Ohio River as slightly below normal.
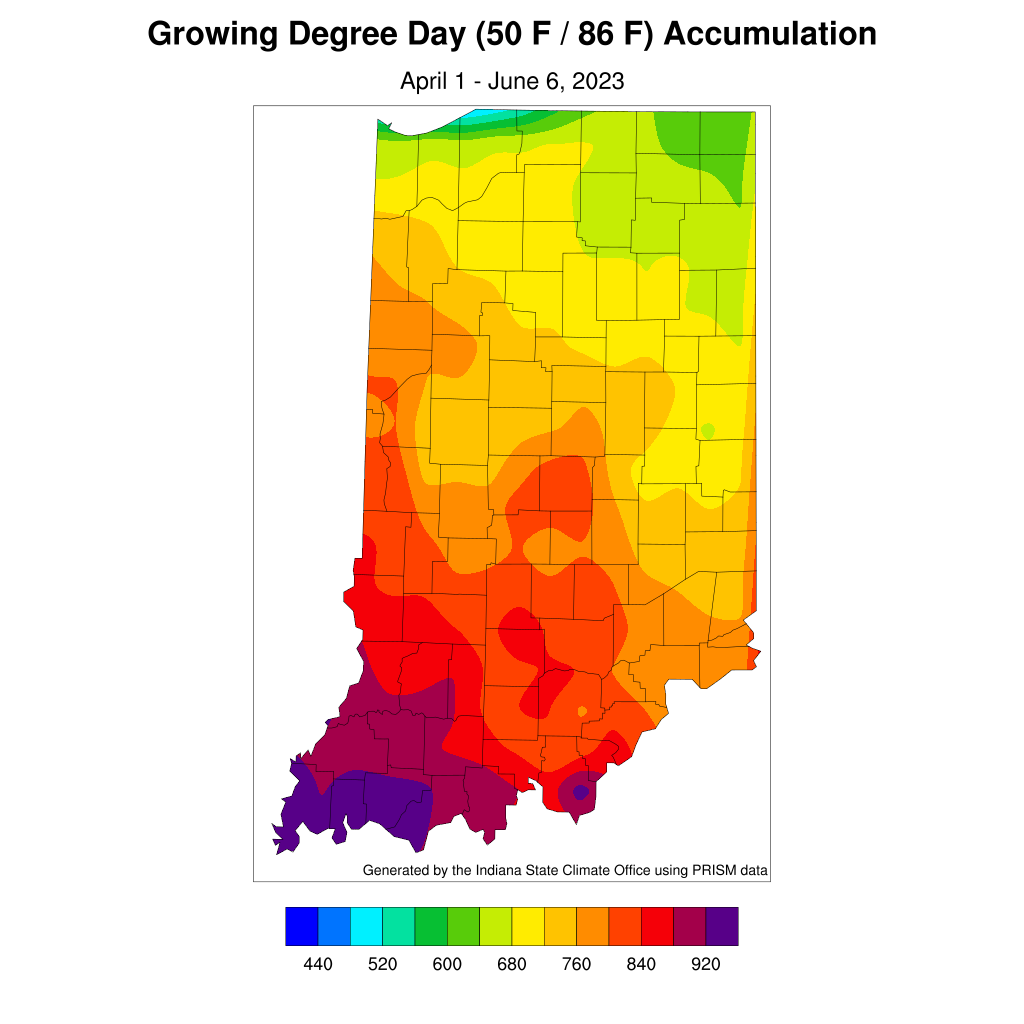
Figure 4. Modified growing degree day (50°F / 86°F) accumulation from April 1-June 6, 2023.
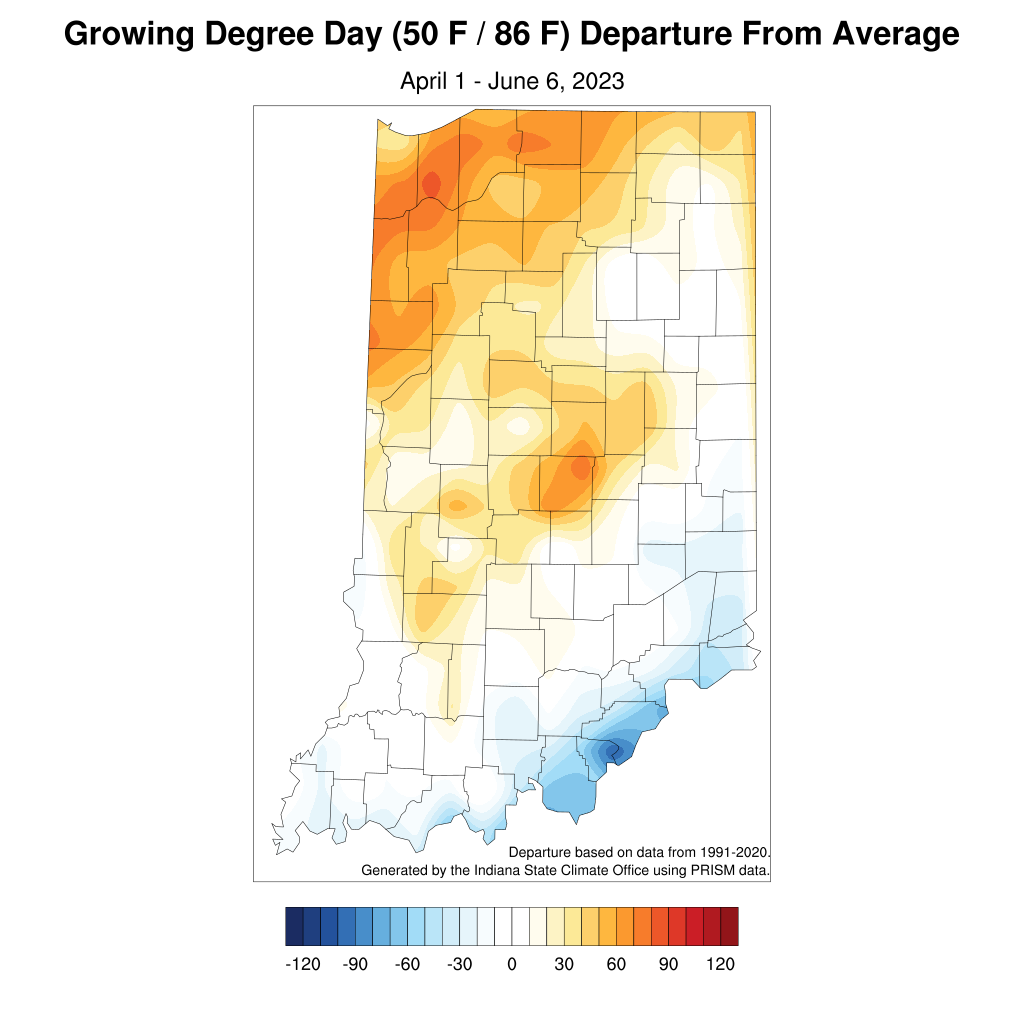
Figure 5. Modified growing degree day (50°F / 86°F) accumulation from April 1-June 6, 2023, represented as the departure from the 1991-2020 climatological average.
