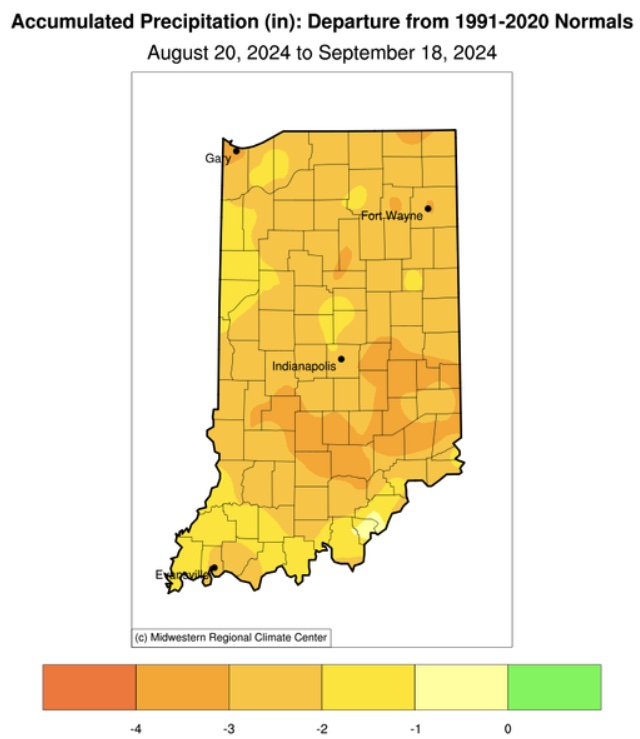
There was a brief period where forecast models were thinking that the remnants of Hurricane Francine might make its way far enough north to provide sufficient moisture to improve drought conditions across the Indiana. As the forecast lead time shortened to only a day or two out, sadly the models had the rain just grazing the southern counties and amounts were hardly enough to make a dent in the rainfall deficits that have been accumulating. Figure 1 shows that over the past 30 days (August 20 through September 18), the entire state is in a precipitation deficit of anywhere from one to four inches. It will take quite a few rain events to make up that gap! Additionally, with the warmer-than-normal temperatures and clear skies, evapotranspiration rates have been relatively high for this time of year. This further exacerbates drought impacts such as vegetation stress, lower surface water levels, and cracked soils.

Figure 1. Accumulated precipitation (in inches) presented as the departure from normal amounts that fell from August 20 through September 18. The climatological normal period is from 1991-2020.
There are several products that puts this current deficit into perspective. The first is from the Midwestern Regional Climate Center that shows the number of days since the last precipitation event of a particular threshold (https://mrcc.purdue.edu/climate_watch/special_topics/drought/dwop-maps). Figure 2 shows the number of days since locations have had at least a quarter inch (0.25”) of precipitation. Notice that across most of the state, except for the southern counties that were grazed by Francine, it has been up to 3 weeks with several areas in eastern Indiana not seeing that much daily rainfall in up to 7 weeks! This tool allows users to choose thresholds of 0.01”, 0.10”, 0.25”, 0.50”, and 1.00” in a 24-hour period.

Figure 2. Number of days since 0.25” of rain fell. Days are approximately from 8am the previous day to 8am the current day due to the timing of manual observation collection.
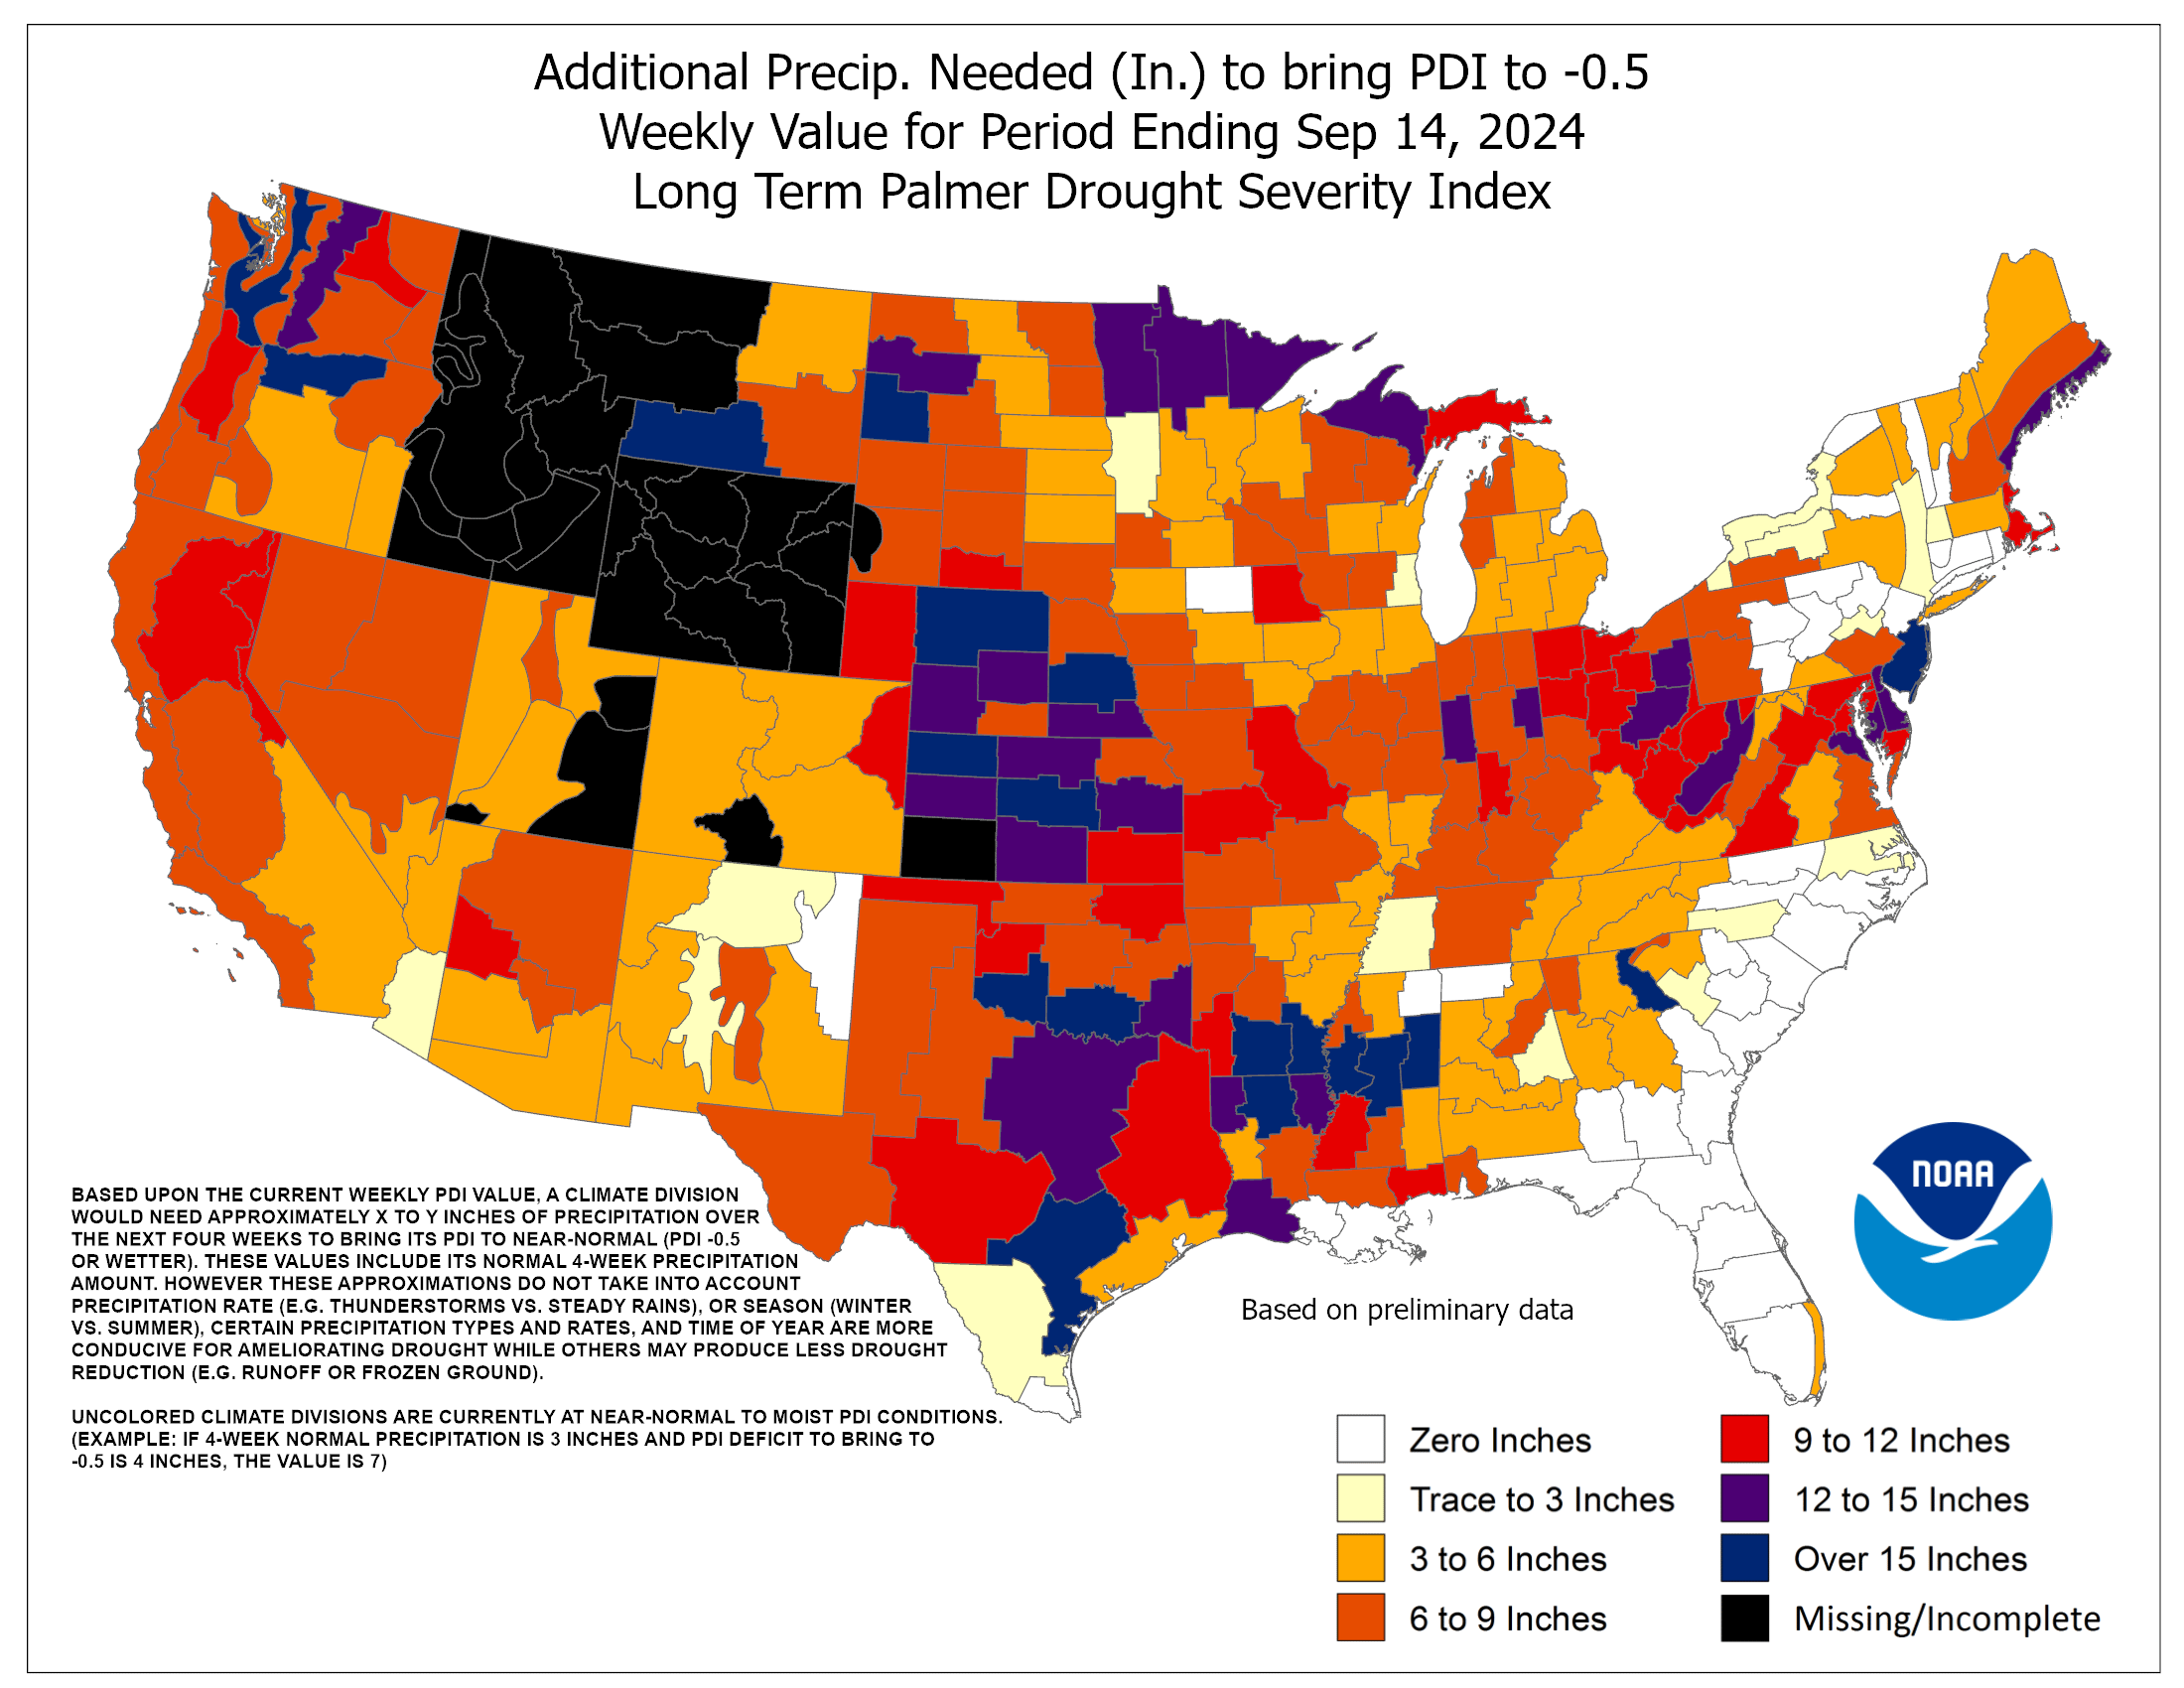
The other product is the national Climate Prediction Center’s map (https://www.cpc.ncep.noaa.gov/products/analysis_monitoring/regional_monitoring/addpcp.gif) showing how much additional precipitation would be needed over the next four weeks to return conditions to near normal. Figure 3 shows that as of September 14th, most climate divisions in Indiana would need 6-9 inches of precipitation with the south-central climate divisions needing 9-12 inches and the west-central and east-central climate divisions needing 12-15 inches! Why are these amounts so much greater than the raw precipitation deficit values shown in Figure 1? Figure 1 is just presenting deficits over the recent 30-day period whereas Figure 3 considers a much longer period. Additionally, Figure 3 is utilizing the Palmer Drought Index that considers soil types, temperature, precipitation, and other environmental conditions that more adequately represent environmental moisture rather than simply how much precipitation fell.

Figure 3. Estimated amount of precipitation needed to return conditions to their normal levels as defined by the Palmer Drought Index. Shaded areas represent climate divisions.
Climate outlooks are strongly favoring above-normal temperatures to continue through the end of September. Outlooks for September 24-27 are slightly favoring above normal precipitation across Indiana with near-normal precipitation expected after that and into early October. Therefore, it is highly likely that drought conditions will continue if not intensify further. Figure 4 shows the most recent U.S. Drought Monitor map that considers conditions through Tuesday, September 17th. The entire state is now categorized as at least Abnormally Dry (D0) with around 66% of the state in Moderate Drought (D1) and 6% in Severe Drought (D2). This has led to burn bans in more than half the counties, so please be aware of the risk of wildfires under these conditions!


