

Timely rains have returned over the past few weeks and have helped crop conditions across the state. Now that we are entering critical corn and soybean growth stages, cooler temperatures and rain are certainly welcome. Although rains have returned, they continue to be inconsistent. Vigo, Sullivan, and Lawrence counties had locations receiving more than 8 inches of rain over the last 30 days (June 11-July 10), which was 3-4 inches above the 1991-2020 climatological average (Figure 1). Northeastern and west-central Indiana ran 1-3 inches below normal in spots, leading to sustained drought over the past several weeks (Figure 2).
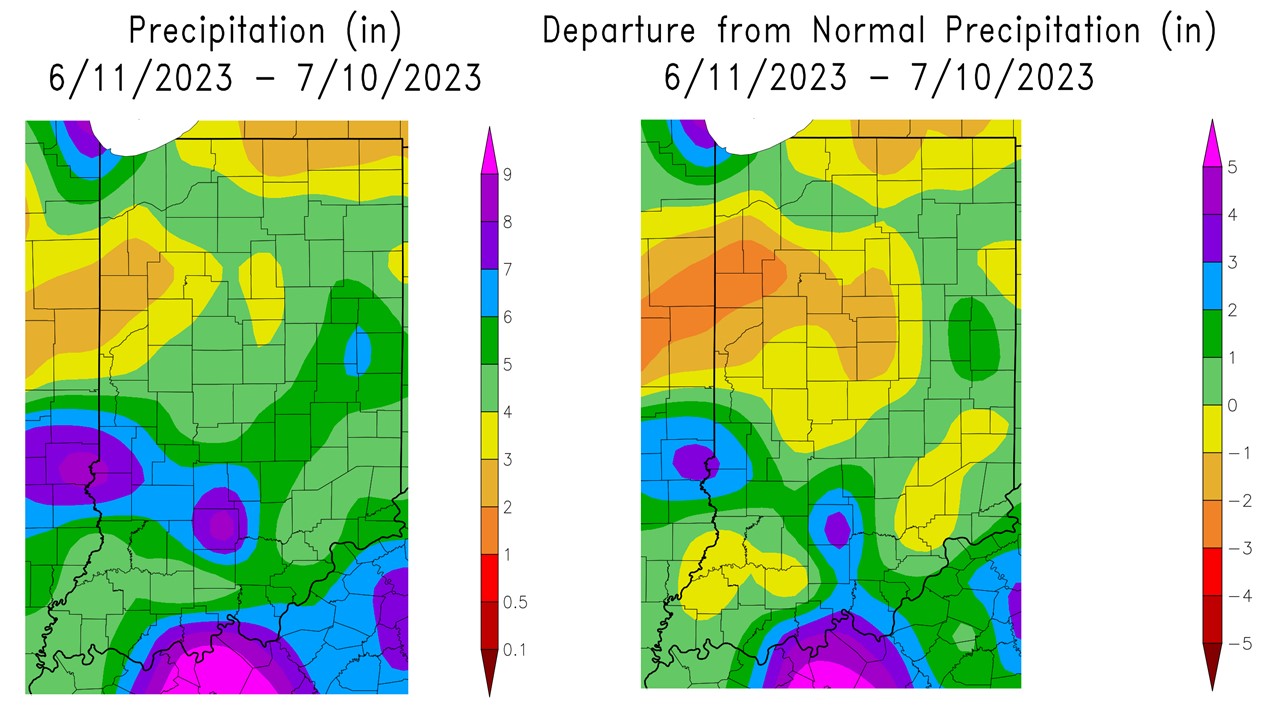
Figure 1: Accumulated precipitation for June 11- July 10, 2023 (left) and accumulated precipitation as a departure from the 1991-2020 climatological normal (right). These maps were obtained from the High Plains Regional Climate Center.
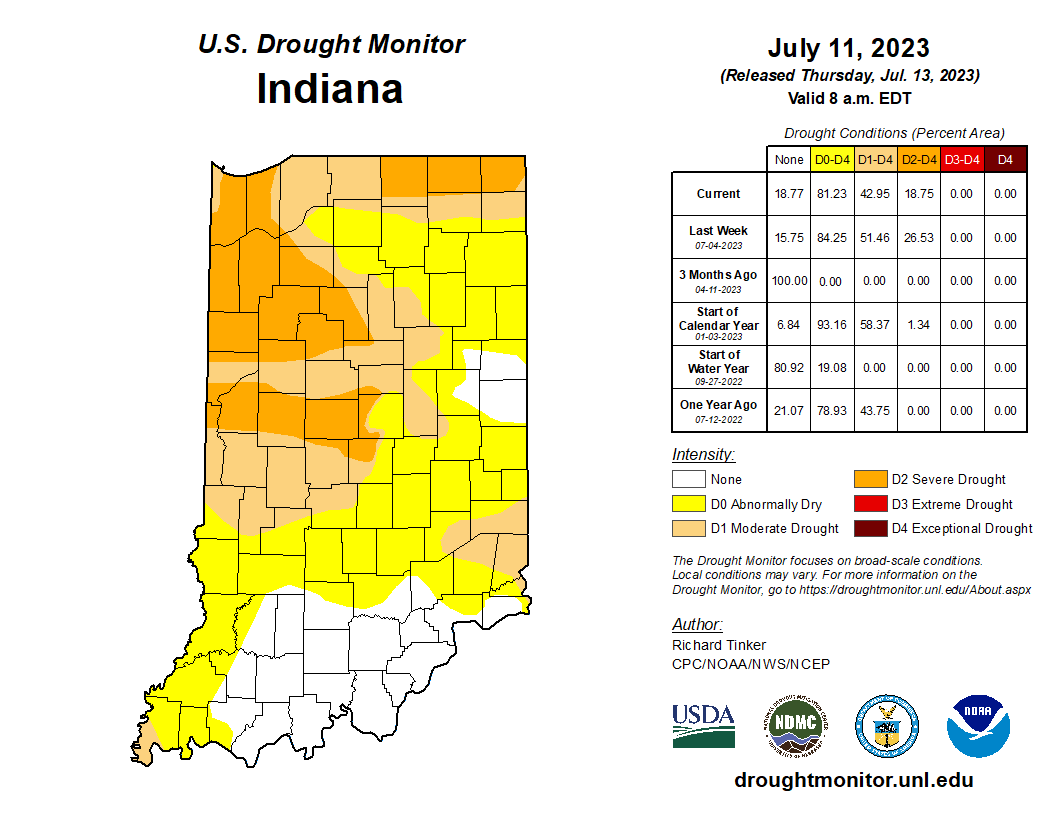
Figure 2: July 11, 2023, US Drought Monitor. The US Drought Monitor is released every Thursday morning by 8:30 AM.
Since June 27th, drought conditions have improved for some, especially in eastern and southern Indiana. The July 11 US Drought Monitor had roughly 43% of Indiana in drought status, which was 8.5% less than last week. Portions of northwest, central, and northeast Indiana continued in severe drought (D2) status. Vegetation conditions have improved, but long-term drought indices still indicate lingering drought stress and impacts in these areas. Continued rains will certainly help conditions improve across the state.
Temperatures have been 1-3°F below normal over the past 30 days (June 11-July 10) (Figure 3). Locations in Lake, Porter, Randolph, and Wayne Counties were between 4-5°F below normal. Since April 1, Modified Growing Degree Days (MGDD) have accumulated between 1300 to 1900 units, which is near normal to 150 units below normal (Figure 4). The MGDD departure is not all that unusual, so there is little concern about delayed progress at this point.
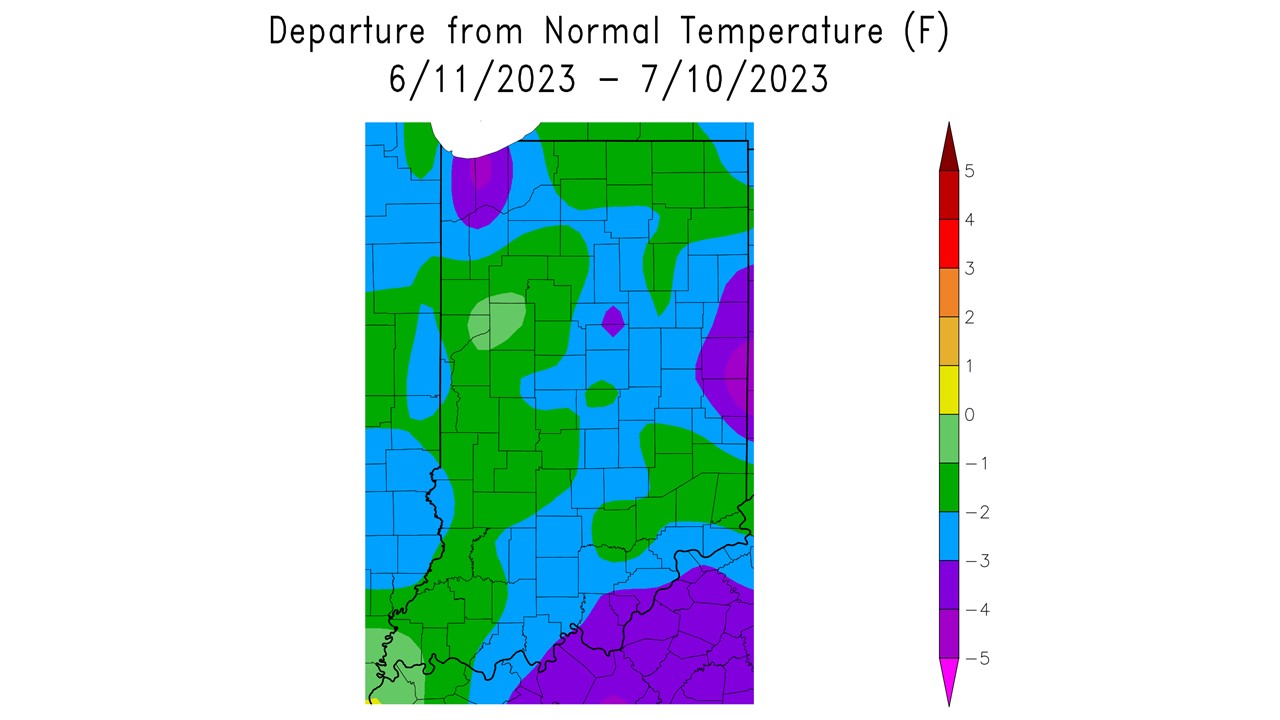
Figure 3: Average temperature for June 11 – July 10, 2023, represented as the departure from the 1991-2020 climatological normal. This map was obtained from the High Plains Regional Climate Center.
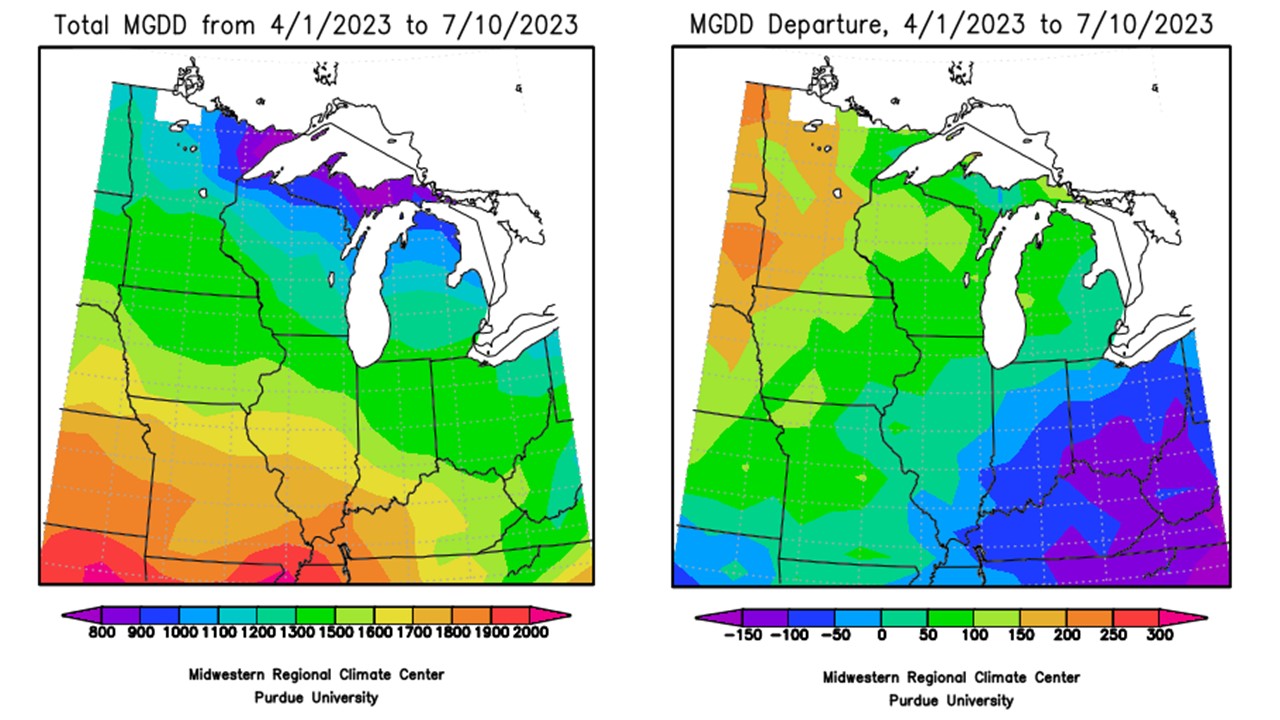
Figure 4: Total Accumulated Indiana Modified Growing Degree Days (MGDDs) April 1-July 10, 2023 (left) and Total Accumulated MGDDs represented as the departure from the 1991-2020 climatological normal (right).
Switching to the outlook, forecasted rain totals through July 19 continue to look variable across the state (Figure 5). South of Indianapolis could see 1.5 to 2 inches. North of Indianapolis could see 1-1.25 inches of rain, which is what we should be getting every week. Northwestern Indiana could also see over 1.5 inches of rain this next week, which should help provide some drought relief. The 6-to-10-day Climate Prediction Center (CPC) outlook (July 17-21) calls for elevated chances of above-normal precipitation statewide. Temperatures are expected to be near normal to slightly below normal at the Indiana-Michigan border (Figure 6). Higher chances for above-normal temperatures creep back in for the 8-to-14-day outlook (July 19-25), accompanied by near-normal precipitation for most of the state (Figure 7). Northern Indiana has slightly elevated chances for below-normal precipitation. The seasonal outlooks have high confidence in above-normal temperatures and low confidence in the precipitation outlook (Figure 8). Some good news, though, is that the US Seasonal Drought Outlook expects some drought removal and improvement across the state (Figure 9).
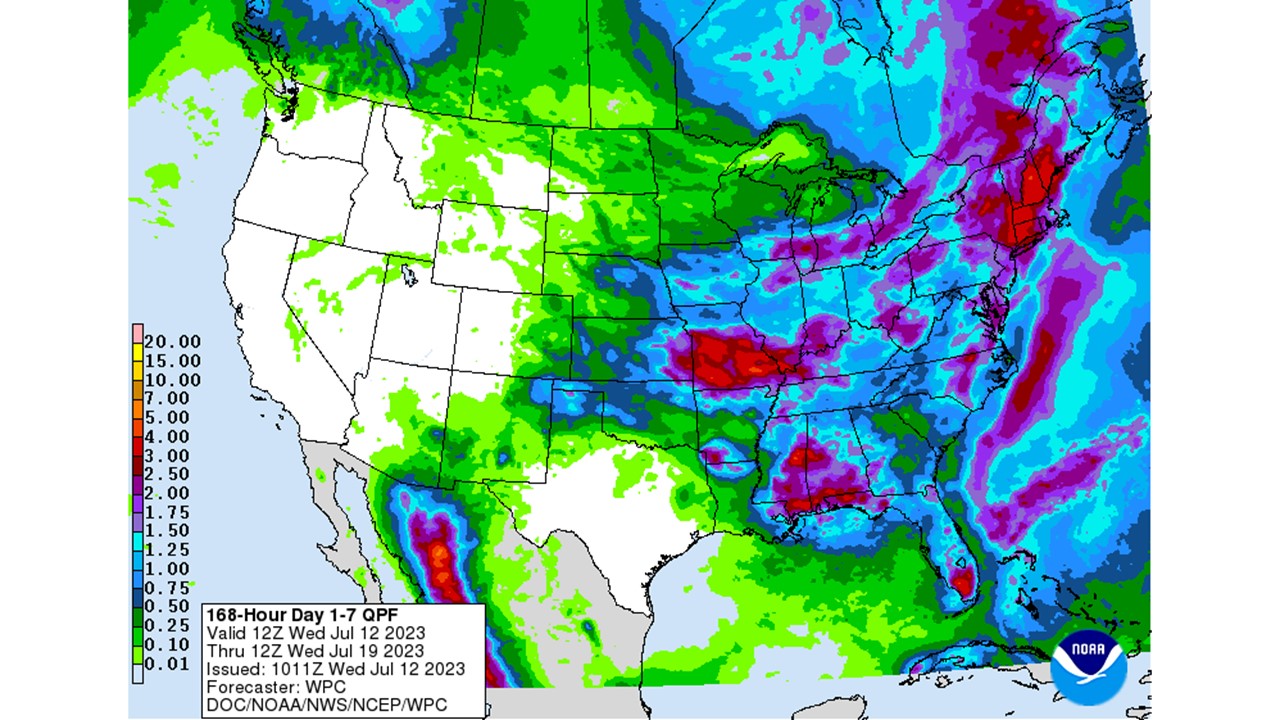
Figure 5: NWS Weather Prediction Center 7-day quantitative precipitation forecast for the continental United States, valid July 12-19, 2023.
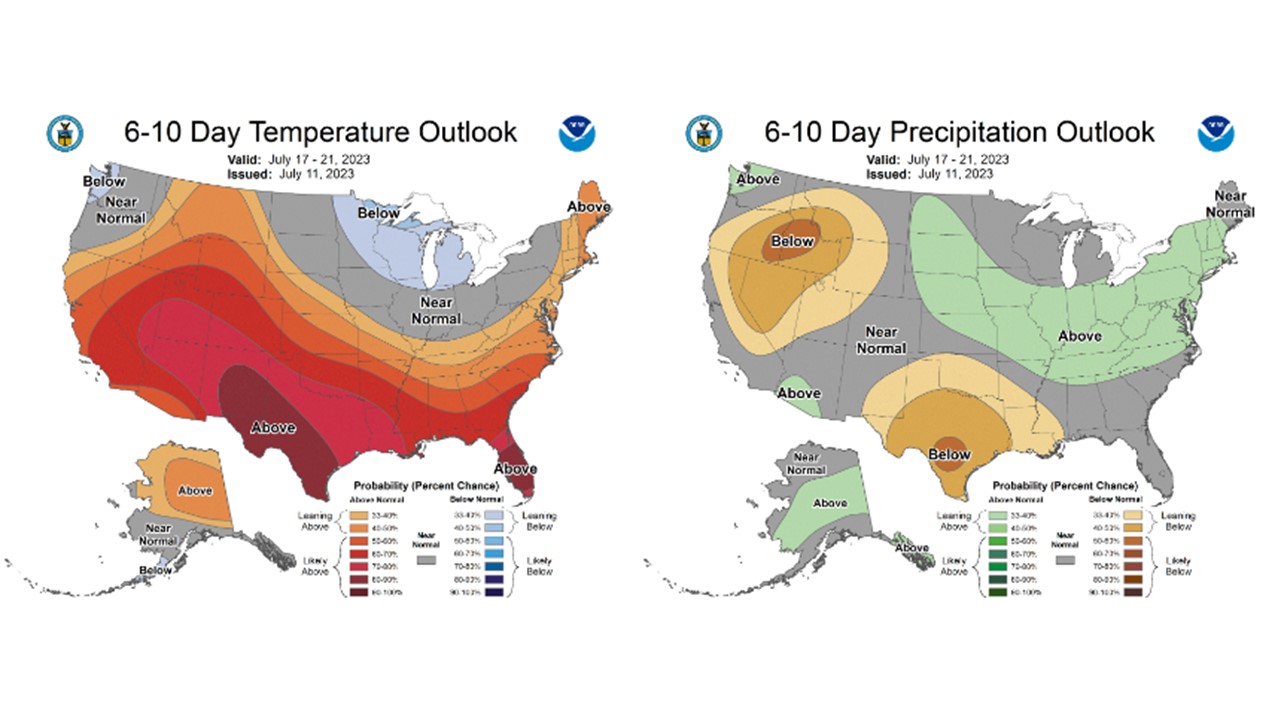
Figure 6: CPC 6-10 day temperature and precipitation outlooks for the United States, valid July 17-21, 2023.
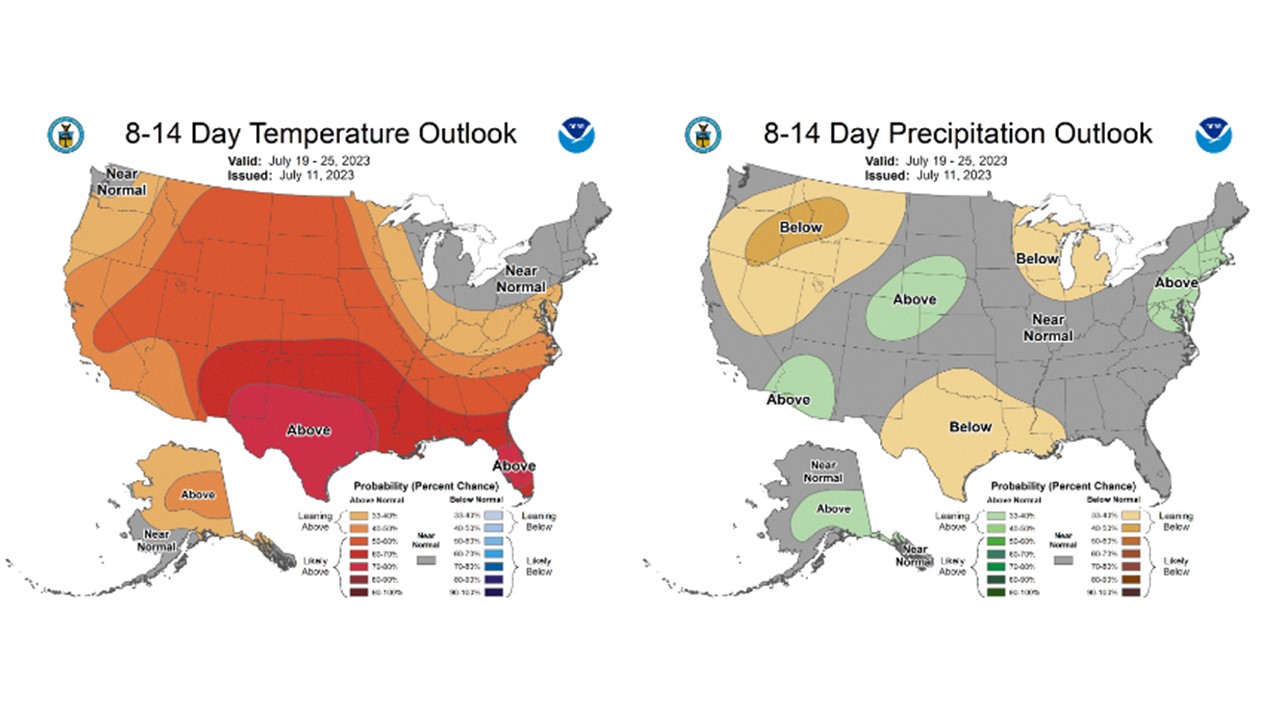
Figure 7: CPC 8-14 day temperature and precipitation outlooks for the United States, valid July 19-25, 2023.
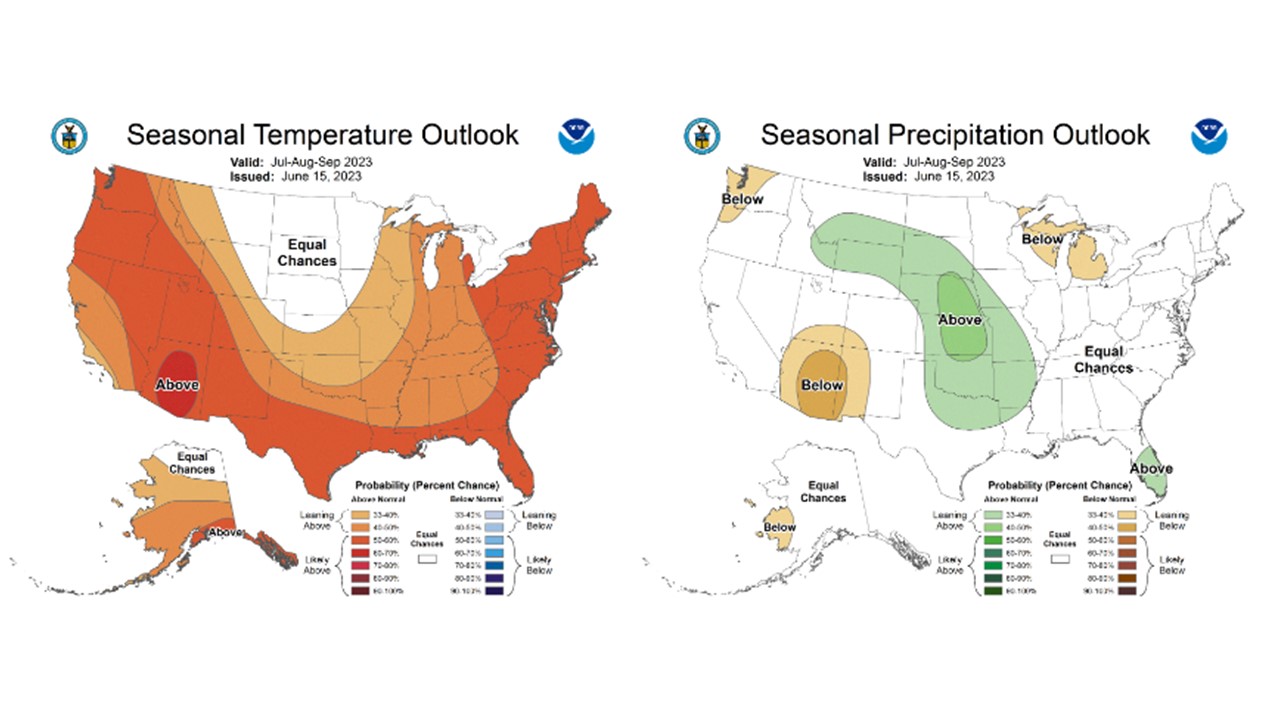
Figure 8: CPC seasonal temperature and precipitation outlooks for the United States, valid July-August-September, 2023.
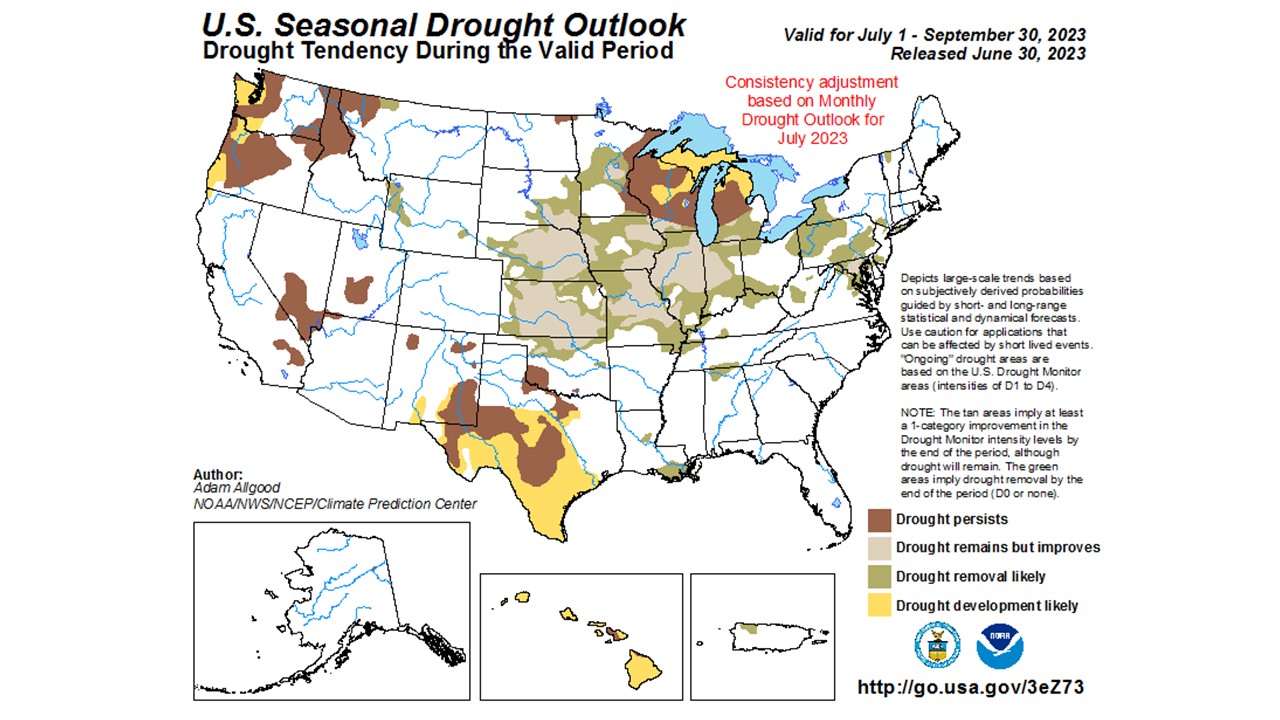
Figure 9: US Seasonal Drought Outlook valid for July 1-September 30, 2023, which is available via the Climate Prediction Center.
