

Corn yield response to increasing nitrogen (N) rate follows the Law of Diminishing Returns – as higher and higher increments of N are applied, the increase in grain yield becomes smaller and smaller (Figure 1). Eventually, maximum yield occurs and applying more N does not increase yield any further.
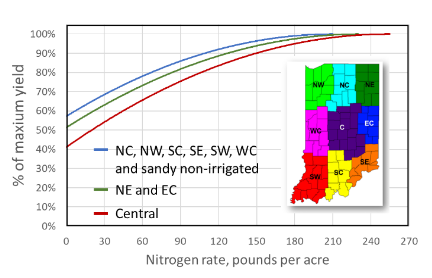
Figure 1. Percent of maximum corn grain yield produced with different nitrogen rates for three groupings of regions in Indiana; northcentral (NC), northwest (NW), southcentral (SC), southeast (SE), southwest (SW), westcentral (WC), and sandy non-irrigated soils, northeast (NE) and eastcentral (EC), and central (C).
Interestingly, maximum yield regarding N fertilization does not produce the maximum profit. Profit from N application is maximized when the value of additional grain produced is just greater than the cost of additional N. Beyond that rate of N, profit declines because the cost of N is more than the value of additional grain produced.
We recommend that farmers select the rate of N to be applied based on the cost of N and the expected value of grain. Currently, the cost of N is historically high, nearly $1 per pound of N from anhydrous ammonia to more than $1 per pound for liquid N. Use Table 1 to find your cost of N per pound from the per ton cost. Grain prices are also relatively high and some expect them to increase in the future.
To obtain the profit–optimizing N rate recommendation for your N cost and expected grain price use the Table for the appropriate regional grouping. For example, assuming N at 1$ per pound and corn at $6.50 per bushel, the optimum profitable N rate for corn after soybeans for the three IN regional groupings would be 191, 209, and 171 pounds of N per acre for fine–textured soils in central (Table 2), northeast and eastcentral (Table 3), and the remainder of Indiana including sandy non–irrigated soils (Table 4). At these profit–optimizing rates the reduction in yield would only be 1–2%, compared to fertilizing for maximum yield.
For more information about how these recommendations were developed and other N management practices that can increase profit, download this online summary:
Jim Camberato, RL (Bob) Nielsen, and Dan Quinn. 2022. Nitrogen Management Guidelines for Corn in Indiana. Purdue University, Agronomy Dept., Applied Crop Research Update. https://www.agry.purdue.edu/ext/corn/news/timeless/NitrogenMgmt.pdf [URL accessed Mar 2022]
| Table 1. Comparative costs per lb. of actual N for a range of costs per ton of product for four fertilizer sources of N commonly used in Indiana. | |||||||
|---|---|---|---|---|---|---|---|
| Anhydrous | N cost/lb | 28% UAN | N cost/lb | 32% UAN | N cost/lb | Urea | N cost/lb |
| $1,200 | $0.73 | $500 | $0.89 | $725 | $1.13 | $825 | $0.90 |
| $1,250 | $0.76 | $525 | $0.94 | $750 | $1.17 | $850 | $0.92 |
| $1,300 | $0.79 | $550 | $0.98 | $775 | $1.21 | $875 | $0.95 |
| $1,350 | $0.82 | $575 | $1.03 | $800 | $1.25 | $900 | $0.98 |
| $1,400 | $0.85 | $600 | $1.07 | $825 | $1.29 | $925 | $1.01 |
| $1,450 | $0.88 | $625 | $1.12 | $850 | $1.33 | $950 | $1.03 |
| $1,500 | $0.91 | $650 | $1.16 | $875 | $1.37 | $975 | $1.06 |
| $1,550 | $0.95 | $675 | $1.21 | $900 | $1.41 | $1000 | $1.09 |
| $1,600 | $0.98 | $700 | $1.25 | $925 | $1.45 | $1025 | $1.11 |
| $1,650 | $1.01 | $725 | $1.29 | $950 | $1.48 | $1,050 | $1.14 |
| $1,700 | $1.04 | $7570 | $1.34 | $975 | $1.52 | $1,075 | $1.17 |
| $1,750 | $1.07 | $775 | $1.38 | $1000 | $1.56 | $1,100 | $1.20 |
| Table 2. Range of economic optimum N rate (EONR) values (lbs applied N/ac) for corn following soybean in central Indiana on medium- and fine-textured soils as influenced by nitrogen cost per lb N (Table 1) and grain price per bushel. The underlying yield response data are from 23 field scale trials conducted from 2006 to date. The average agronomic optimum N rate for this region of Indiana is approximately 232 lbs N/ac. These rates assume N management practices that minimize the risk of N loss prior to plant uptake. | |||||||
|---|---|---|---|---|---|---|---|
| Central Indiana | |||||||
| Grain Price | |||||||
| N cost | $4.50 | $5.00 | $5.50 | $6.00 | $6.50 | $7.00 | $7.50 |
| $0.60 | 196 | 200 | 203 | 205 | 207 | 209 | 211 |
| $0.75 | 187 | 192 | 195 | 198 | 201 | 203 | 205 |
| $0.90 | 178 | 184 | 188 | 192 | 195 | 197 | 200 |
| $1.05 | 169 | 175 | 181 | 185 | 189 | 192 | 194 |
| $1.20 | 160 | 167 | 173 | 178 | 182 | 186 | 189 |
| $1.35 | 151 | 159 | 166 | 171 | 176 | 180 | 184 |
| $1.50 | 142 | 151 | 158 | 165 | 170 | 174 | 178 |
| $1.65 | 133 | 143 | 151 | 158 | 164 | 168 | 173 |
| Table 3. Range of economic optimum N rate (EONR) values (lbs applied N/ac) for corn following soybean in northeast and eastcentral Indiana on medium- and fine-textured soils as influenced by nitrogen cost per lb N (Table 1) and grain price per bushel. The underlying yield response data are from 37 field scale trials conducted from 2006 to date. The average agronomic optimum N rate for these regions of Indiana is approximately 254 lbs N/ac. These rates assume N management practices that minimize the risk of N loss prior to plant uptake. | |||||||
|---|---|---|---|---|---|---|---|
| Northeast & Eastcentral Indiana | |||||||
| Grain Price | |||||||
| N cost | $4.50 | $5.00 | $5.50 | $6.00 | $6.50 | $7.00 | $7.50 |
| $0.60 | 215 | 219 | 222 | 225 | 227 | 229 | 231 |
| $0.75 | 205 | 210 | 214 | 217 | 220 | 223 | 225 |
| $0.90 | 195 | 201 | 206 | 210 | 213 | 216 | 219 |
| $1.05 | 185 | 192 | 198 | 203 | 207 | 210 | 213 |
| $1.20 | 176 | 184 | 190 | 195 | 200 | 204 | 207 |
| $1.35 | 166 | 175 | 182 | 188 | 193 | 197 | 201 |
| $1.50 | 156 | 166 | 174 | 181 | 186 | 1891 | 195 |
| $1.65 | 146 | 1557 | 166 | 173 | 179 | 185 | 189 |
| Table 4. Range of economic optimum N rate (EONR) values (lbs applied N/ac) for corn following soybean in northcentral, northwest, southcentral, southeast, southwest, and westcentral Indiana on medium- and fine-textured soils, plus sandy non-irrigated areas throughout the state as influenced by nitrogen cost per lb N (Table 1) and grain price per bushel. The underlying yield response data are from 106 field scale trials conducted from 2006 to date. The average agronomic optimum N rate for these regions of Indiana is approximately 211 lbs N/ac. These rates assume N management practices that minimize the risk of N loss prior to plant uptake. | |||||||
|---|---|---|---|---|---|---|---|
| Northcentral, Northeast, Southcentral, Southeast, Southwest, Westcentral +Sandy Non-irrigated Areas of Indiana | |||||||
| Grain Price | |||||||
| N cost | $4.50 | $5.00 | $5.50 | $6.00 | $6.50 | $7.00 | $7.50 |
| $0.60 | 176 | 180 | 182 | 185 | 187 | 188 | 190 |
| $0.75 | 167 | 172 | 1575 | 178 | 181 | 183 | 185 |
| $0.90 | 159 | 164 | 168 | 172 | 175 | 177 | 180 |
| $1.05 | 150 | 156 | 161 | 165 | 169 | 172 | 174 |
| $1.20 | 141 | 148 | 154 | 159 | 163 | 166 | 169 |
| $1.35 | 132 | 140 | 147 | 152 | 157 | 160 | 164 |
| $1.50 | 124 | 132 | 139 | 145 | 150 | 155 | 159 |
| $1.65 | 115 | 124 | 132 | 139 | 144 | 149 | 153 |
