

Indiana adds one more week to its months-long streak of having no drought across the state. In fact, from March 1st through April 14th (45 days), 35 of those days (78%) had precipitation in South Bend (31 days), Indianapolis (26 days), and/or Evansville (25 days). That’s not too many dry days to keep those patio cushions outside without them getting wet! Regardless of how many wet days Indiana has had lately, the total amount of precipitation from March 1 through April 15th has been relatively close to normal (Figure 1). The southeastern part of the state has been drier than normal, but otherwise, most of the state is within 75% to 125% of normal (where 100% would equal normal). In fact, for this time of year, Indiana averages around an inch of precipitation in any 7-day period. Will this end soon? Climatologically, June is the wettest month for the Indianapolis area, followed by May, July, and then April. Therefore, if this year is close to normal, then there is still more precipitation to be expected. However, global climate patterns are still being influenced by La Niña and climate change has led to more heavier precipitation events than past decades – both factors suggesting above-normal precipitation. There is some potentially good news, though. The 6-to-10-day (April 20-24) climate outlook, as well as the 8-to-15-day (April 22-28) climate outlook, is favoring above-normal temperatures and below-normal precipitation for our area. Hopefully, this will bring some respite to this wet pattern and allow us time to enjoy the outdoors for a few days!
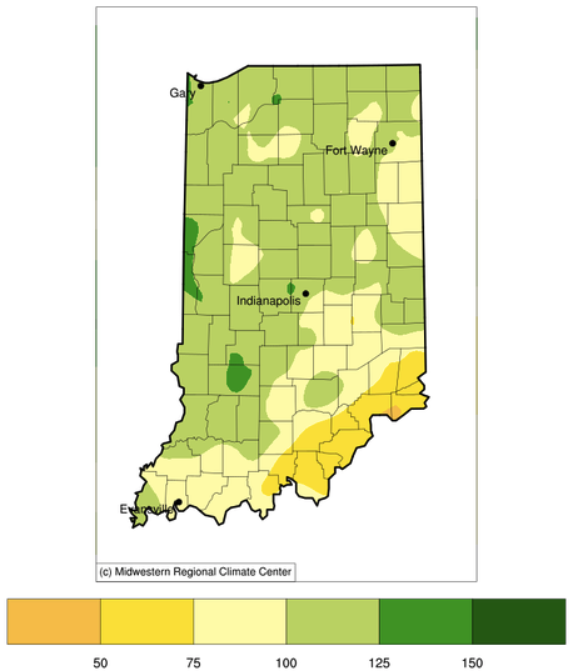
Figure 1. Accumulated Precipitation (in inches) represented as the percent of the 1991-2020 climatological normal period from March 1, 2022 through April 15, 2022.
Temperatures across our state have averaged near normal over the last 30 days with a few pockets of slightly cooler-than-normal conditions. There were a some warmer periods during this time, which has allowed growing degree days to start to accumulate (Figure 2), however, they are slightly behind what is normally expected for this time of year (Figure 3).
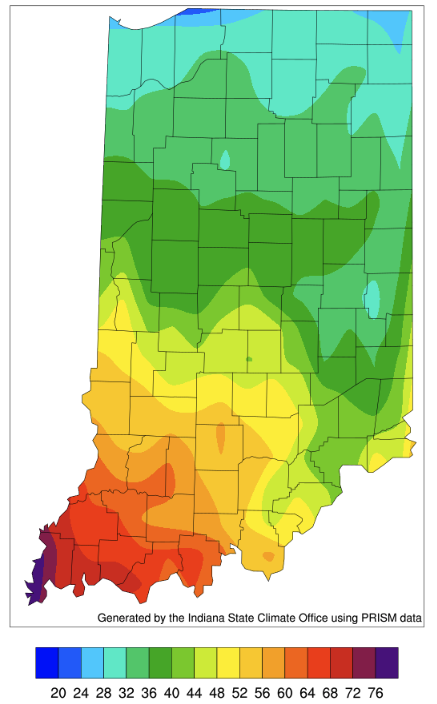
Figure 2. Modified growing degree day (50°F / 86°F) accumulation from April 1-14, 2022.
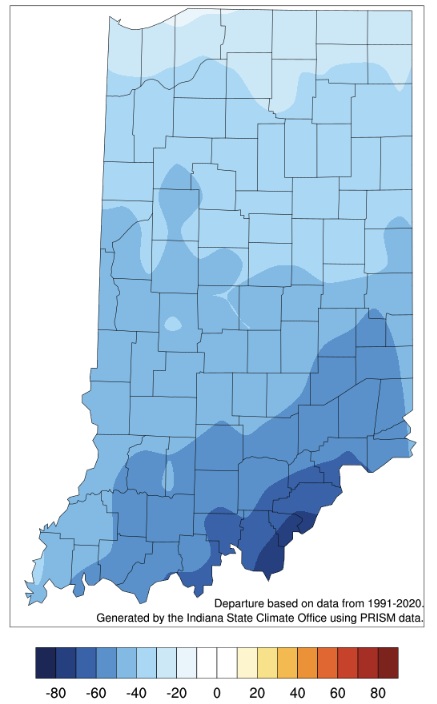
Figure 3. Modified growing degree day (50°F / 86°F) accumulation from April 1-14, 2022 represented as the departure from the 1991-2020 climatological average.
