Soil temperatures are often a guide for various timing decisions in agriculture. In the spring, once soil temperature (often at 4” depths) are sustained above a particular threshold (e.g., 50°F), field preparations and planting can progress, for example. Temperatures may also relate to pest and weed emergence, as well. The Midwestern Regional Climate Center, in partnership with the USDA’s Midwest Climate Hub, developed a soil temperature climatology tool that provides historical 4” soil temperature summaries based on data from 1991-2020. A user can select a temperature threshold between 30° F and 60° F to see the earliest, average and latest dates when the 7-day average temperature either rose above (e.g., spring) or fell below (e.g., fall) that value (see Figure 1 for an example). In contract, a user can select a particular date (e.g., April 20th) and view what the coldest, average, and warmest 4”, 7-day average soil temperature was. To view current, observed 4” soil temperatures, the Purdue Mesonet provides real-time observations for multiple locations around the state.
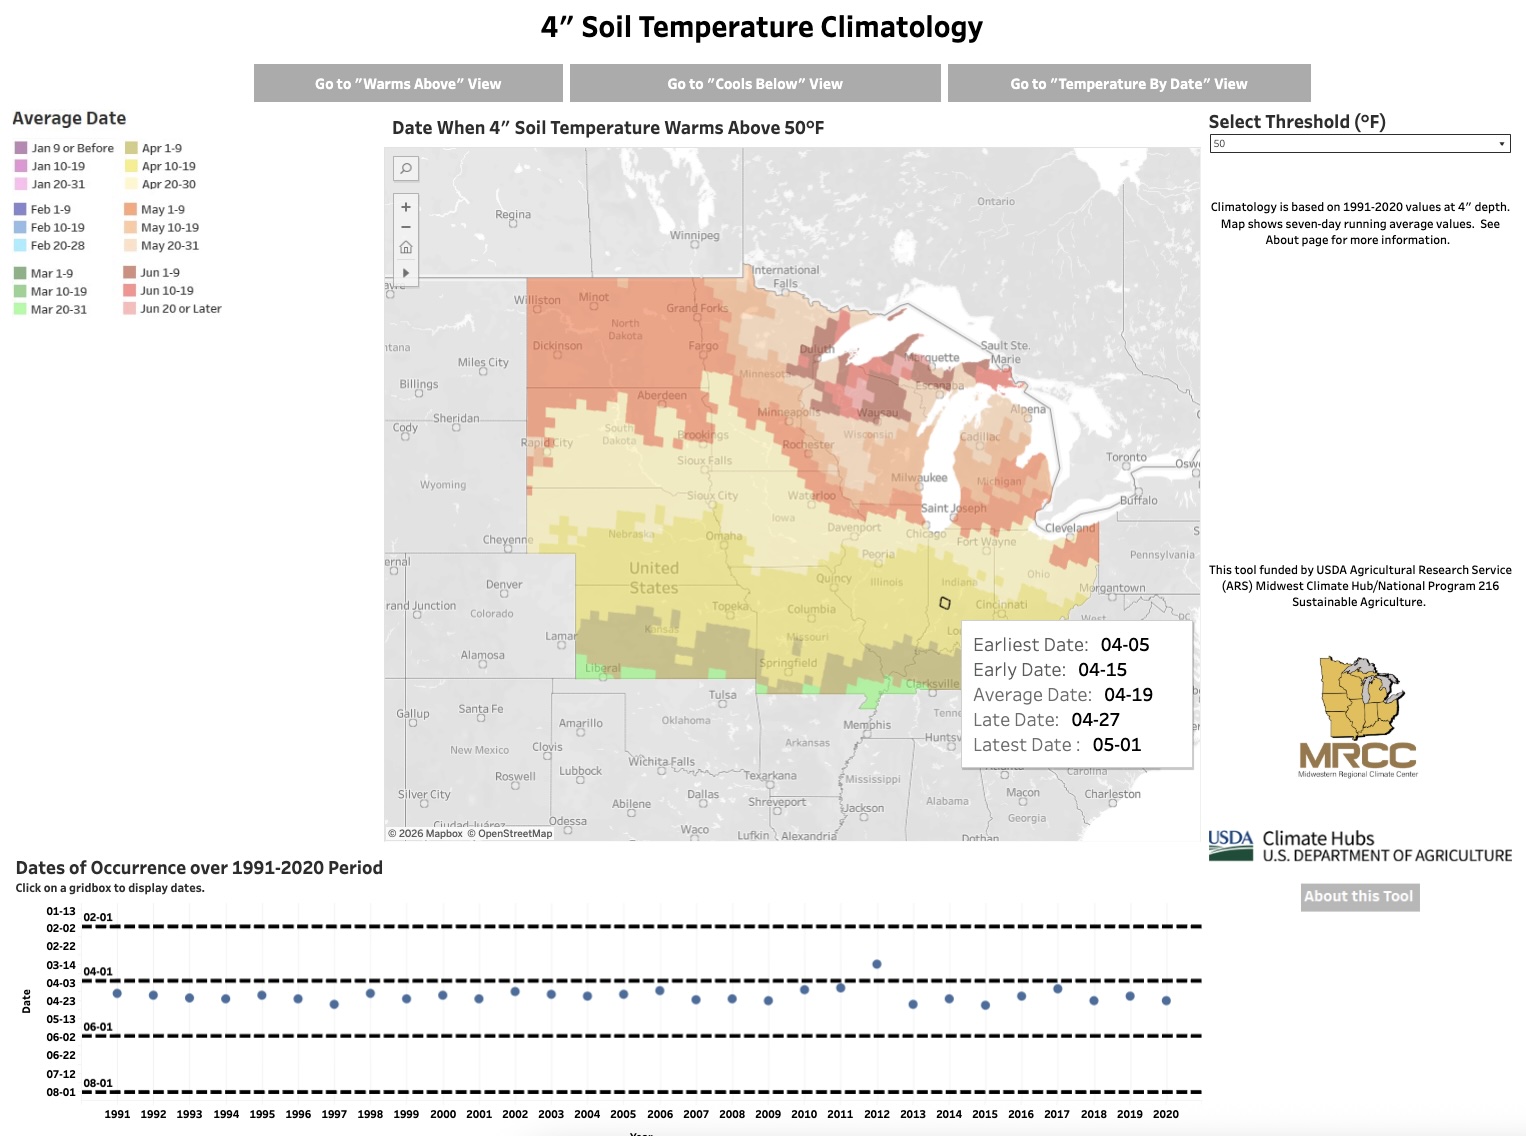
Figure 1. Screenshot of the 4” soil temperature climatology tool using a 50°F temperature threshold.
Over the past 2 weeks, precipitation amounts have been slightly above normal in northern Indiana, with central and southern Indiana (Figure 2). This has allowed conditions across north-central Indiana to stay in the “Abnormally Dry (D0)” category for the U.S. Drought Monitor, whereas southwestern Indiana’s “Abnormally Dry (D0)” area has slightly expanded (Figure 3). The 7-day precipitation forecast has rain continuing into the early part of this weekend and then offering us a break for a few days until the next round is expected at the end of next week (accompanied by some chillier overnight lows). Total amounts over the 7-day period (April 16-23) are predicting around an inch across most of the state.

Figure 2. Precipitation departures (in inches) from normal (1991-2020) for April 2-15, 2026.

Figure 3. U.S. Drought Monitor status for conditions as of early Tuesday, April 14, 2026.
Looking ahead to the 6-to-14-day (April 21-29) climate outlooks, temperatures are slightly favored to be above normal in the earlier part of that period and then return to normal by the end. Precipitation is favored to be above normal across Indiana for the period, with the great confidence of above-normal amounts in southern counties.