

On May 21st, the national Climate Prediction Center released the June-July-August summer outlook for temperature and precipitation (Figure 1). While the 3-month precipitation outlook is showing confidence for wetter-than-normal conditions, the temperature outlook has a significant area of “equal chances”. This indicates that the predictive models could not reconcile with consistency whether temperatures will be above or below normal. The rest of the country has varying levels of confidence for above-normal temperatures. Therefore, it may be reasonable to assume that the Midwest will also experience above-normal temperatures, but the moderating effect of excess soil moisture may dampen the impact.
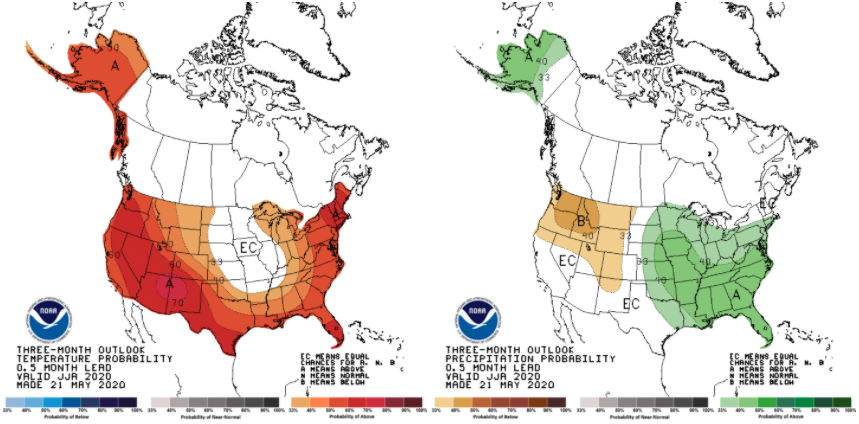
Figure 1. The June-July-August temperature (left) and precipitation (right) outlooks indicating the probabilistic confidence of conditions likely to be above or below normal.
Typical of Indiana springs, day-to-day temperatures seem to be swinging widely from relatively cool conditions to impressively hot conditions. Memorial Day weekend brought in some very warm days with temperatures 10-15 degrees above normal between May 24th and 27th! This helped to boost the modified growing degree-day accumulations (Figure 2), but these accumulations are still 60-180 units below the 1990-2019 period average (Figure 3). The Indiana State Climate Office is now providing daily updated GDD maps (https://ag.purdue.edu/indiana-state-climate/growing-degree-day-climate-maps/) for the state with accumulation start dates of April 1, April 15, and May 1.
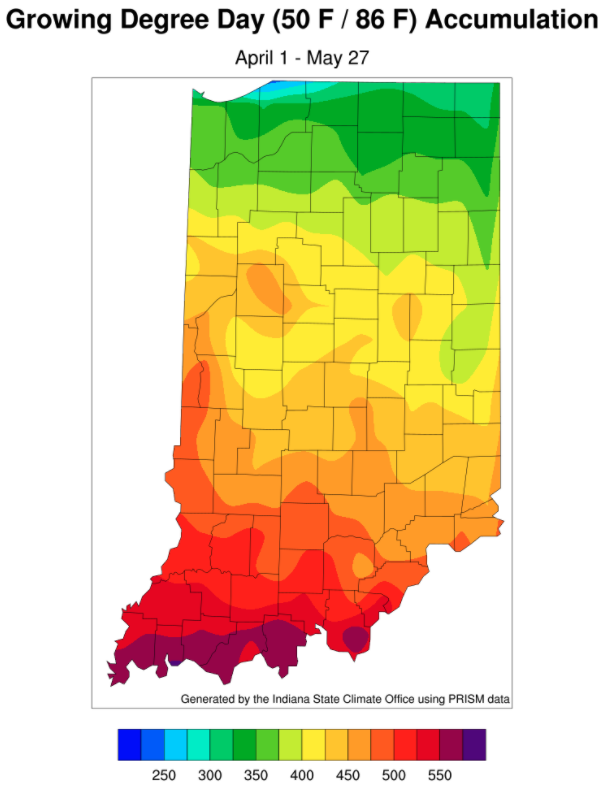
Figure 2. Modified growing degree-day accumulations for April 1 through May 27, 2020.
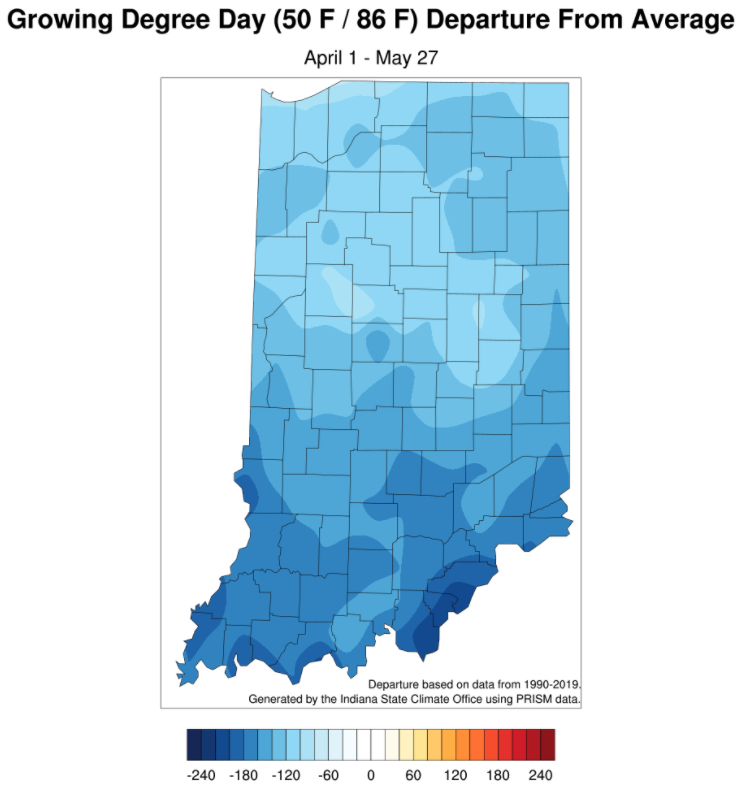
Figure 3. The April 1 through May 27, 2020 modified growing degree-day accumulation departure from the 1990-2019 period average.
