

Something exciting happened this past Monday that many of you might be glad is over and no longer filling your news feed – the total solar eclipse. The Indiana State Climate Office, however, is now getting a chance to dig into the data collected from the Purdue Mesonet – a collection of 14 weather stations around the state – to see the various weather impacts from the event. While 3-second data was collected throughout most of the daylight hours on Monday (and yet to be analyzed), the public can view changes in the 5-minute data on the Purdue Mesonet Data Hub by clicking on a station, then scrolling down through the time series of various variables. All stations across Indiana experienced a drop in incoming solar radiation (no surprise there), but most stations also recorded at least a 5-degree drop in temperature (Figure 1) and a decrease in wind speed of approximately 5 miles per hour! Check out the data for the station closest to where you were and recall if you felt those various changes!
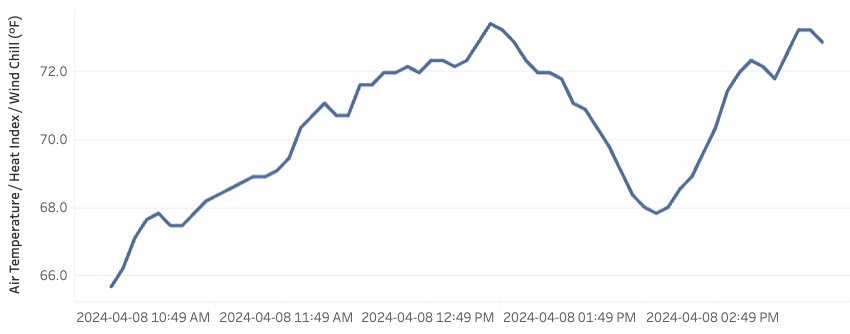
Figure 1. Example time series of temperature during the total solar eclipse that peaked around 2:00 PM local standard time (note: this is 3:00 PM local daylight time) for a station in Randolph County.
Precipitation continues to be above normal with most of Indiana having received at least 200 percent of normal amounts since the beginning of April (Figure 2). While last week has been on the drier side, by the middle and near end of this week more rain has come, keeping amounts high enough to eliminate any drought with only southwest Indiana counties in Abnormally Dry category according to the U.S. Drought Monitor (Figure 3).
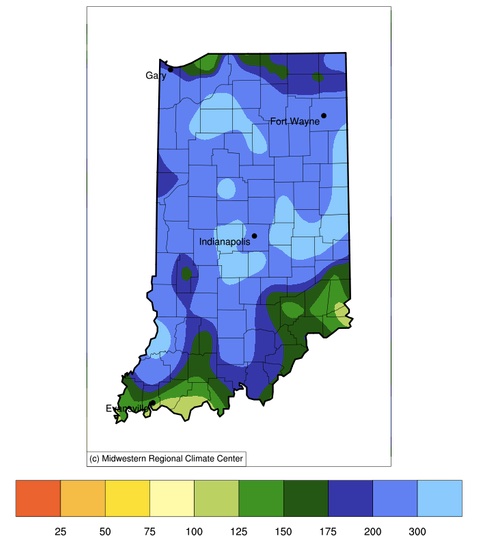
Figure 2. Percent of normal precipitation based upon the 1991-2020 period for April 1st through the morning of April 11th, 2024. Areas above 100 percent are wetter than normal.
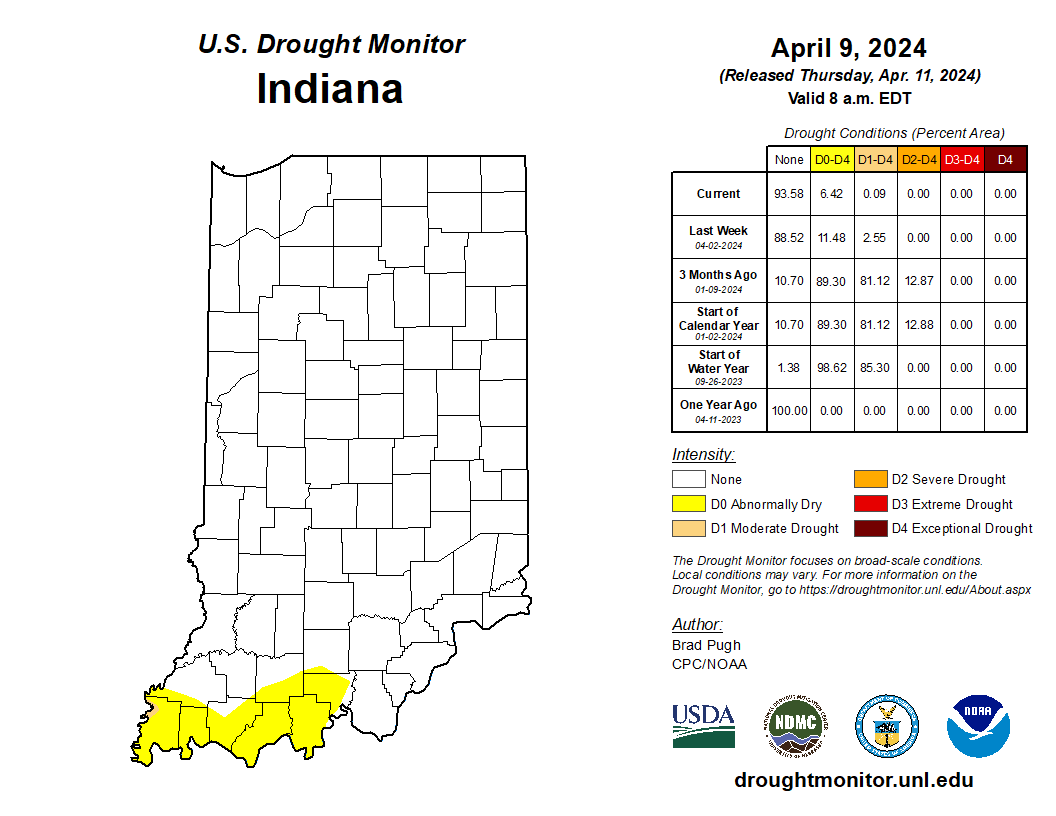
Figure 3. U.S. Drought Monitor map for Indiana based on data through the morning of Tuesday, April 9th.
Modified growing degree days since April 1st are within 5 units of normal as of April 11th with accumulations ranging from 70 units in southern Indiana to as low as 30 units in northern Indiana. Hopefully, this product will get more exciting with time, particularly since the national Climate Prediction Center (CPC) is strongly favoring above-normal temperature over the April 16-20 period. The CPC is also strongly favoring above-normal precipitation over this same period with a possible continuation of wetter-than-normal conditions likely for the following week.
