

It is May, the sun is shining, of course the wind is blowing, and the weather forecast is calling for warmer temperatures. Things are looking up from here. Despite the warm start and cool end to April, the preliminary statewide average temperature ran 1.2°F above normal (Figure 1). The largest temperature departures occurred in northern Indiana (near 2.0°F above normal). Rockville, located in Parke County, recorded the lowest minimum temperature in the state for the month (21°F) on April 24. The station’s highest temperature, 85°F, occurred just four days earlier. If I can do my math right, that’s a 64°F temperature drop in four days… brrr. Modified growing degree days (MGDDs) got off to a quick start, but tapered off toward the end of the month. As of May 2, the state accumulated 140-350 MGDDs (Figure 2) and are running within 40 units of normal. Similar to last week, soil temperatures hovered in the mid-40s to mid-50s (Figure 3).
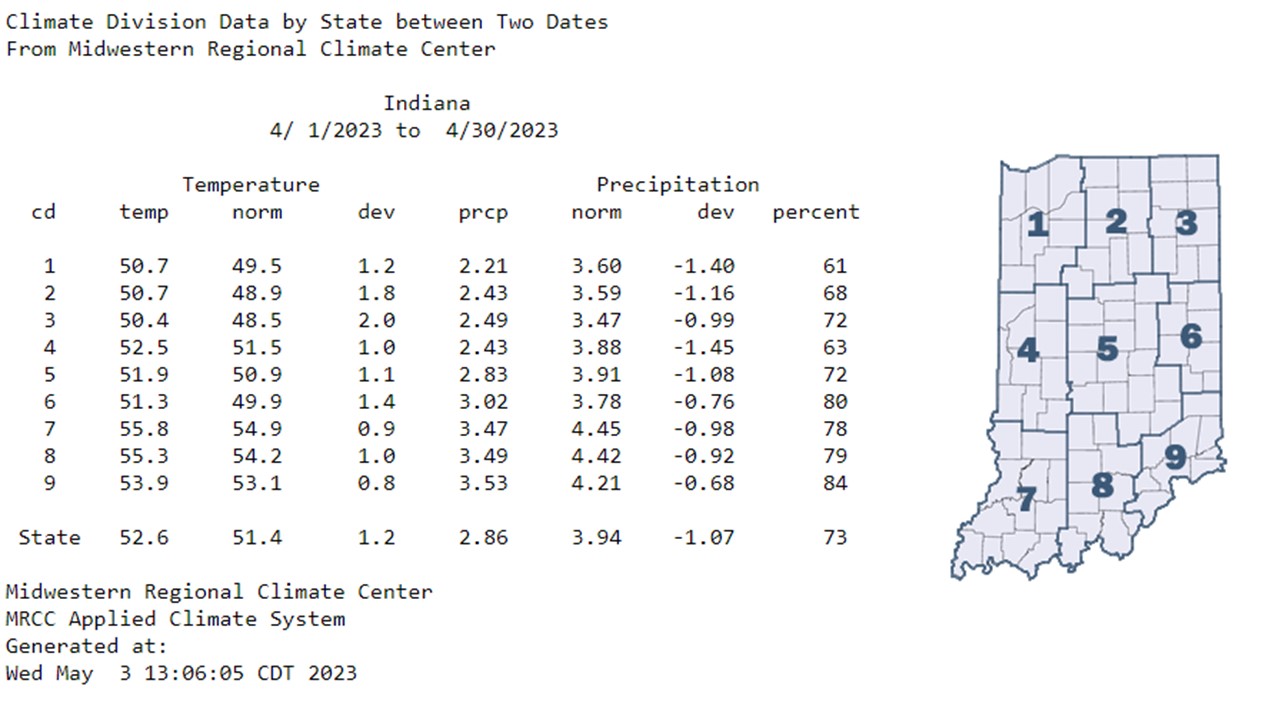
Figure 1: Indiana climate division and state temperature, normal temperature, temperature departure from normal, precipitation, normal precipitation, precipitation departure from normal, and percent of mean precipitation for April 1-30, 2023.
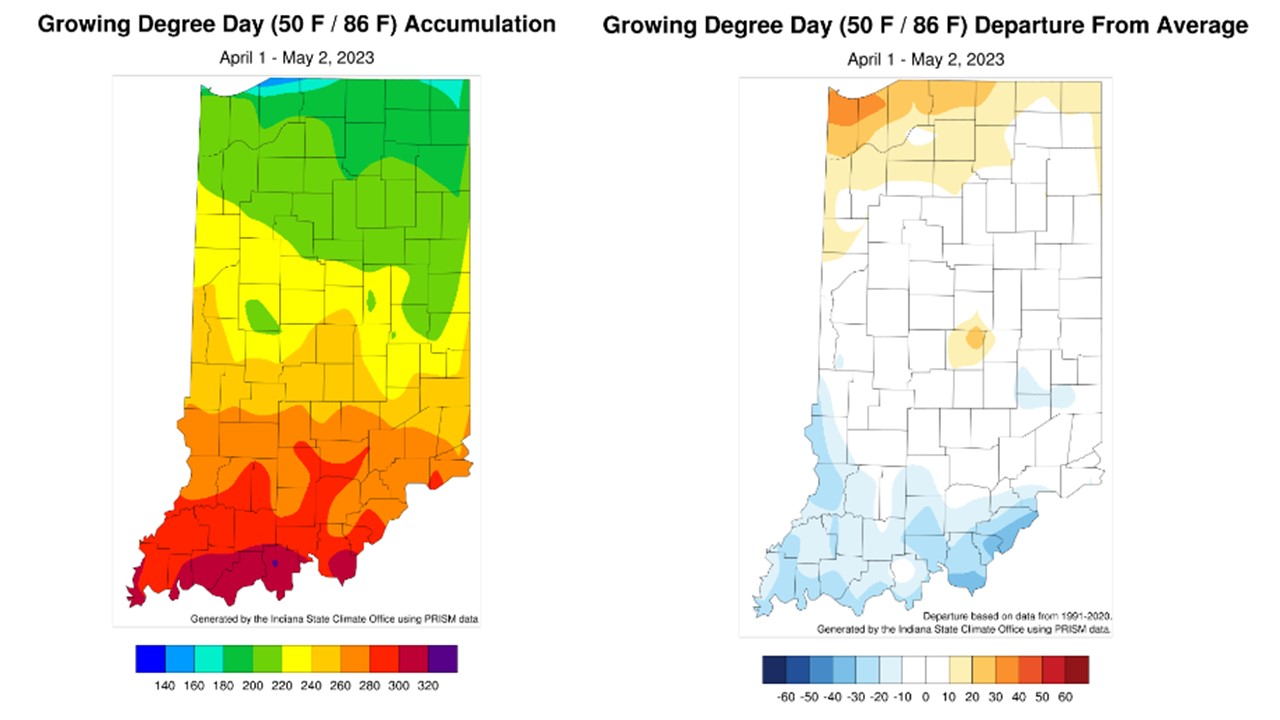
Figure 2: Total Accumulated Indiana Modified Growing Degree Days (MGDDs) April 1-May 2, 2023 (left) and Total Accumulated MGDDs represented as the departure from the 1991-2020 climatological normal (right).
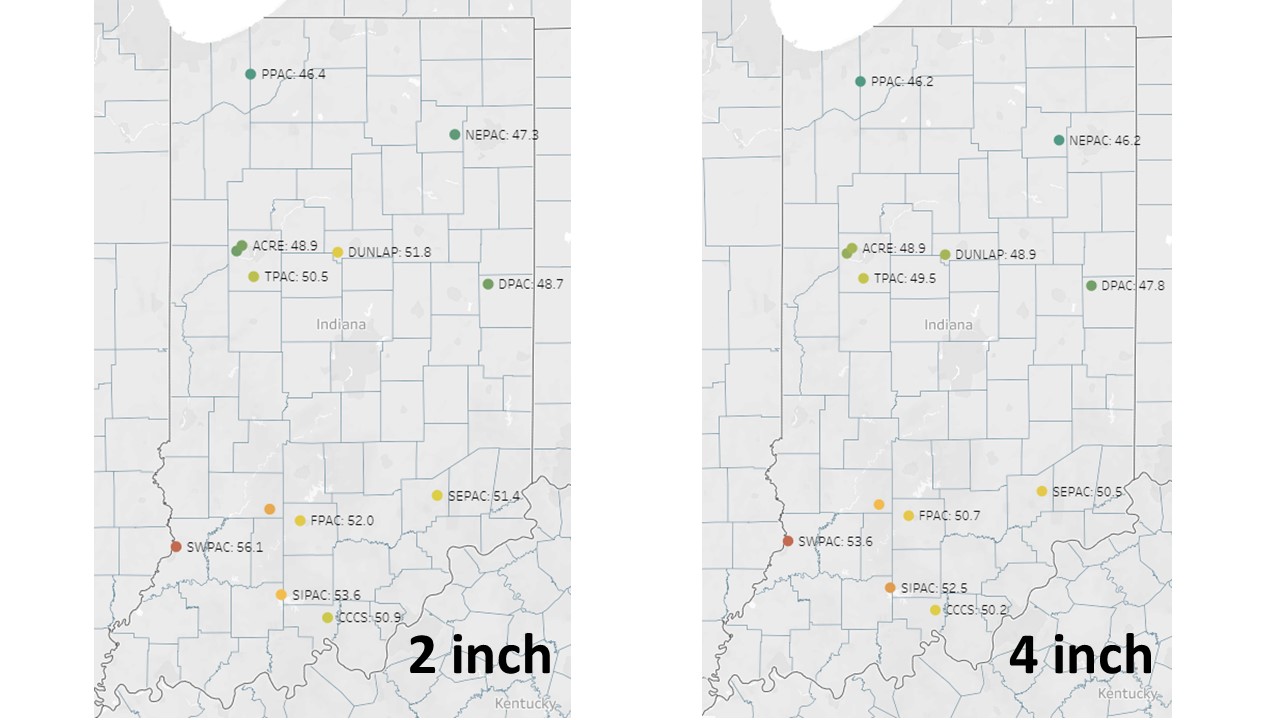
Figure 3: Two-inch (left) and four-inch (right) soil temperatures for stations located at Purdue Mesonet sites in Indiana on May 3, 2023. Data can be obtained from the Purdue Mesonet Data Hub.
Preliminary April precipitation averaged 73 percent of normal statewide, but larger departures occurred in the north (Figure 1). Over the last 30 days (April 4-May 3), precipitation ranged 25-75 percent of normal (Figure 4). Cold temperatures aloft allowed showers with mixed precipitation to fall during the last two weekends of the month. Locations even saw minor accumulations of sleet and hail. Rensselaer WWTP (Jasper County) measured 1.42 inches of precipitation over the last 30 days, which was 2.58 inches below the 1991-2020 climatological normal. Driest locations were in western Indiana, which reintroduces drought concerns moving into the next couple of weeks. However, the rain forecast does indicate rain over the next week.
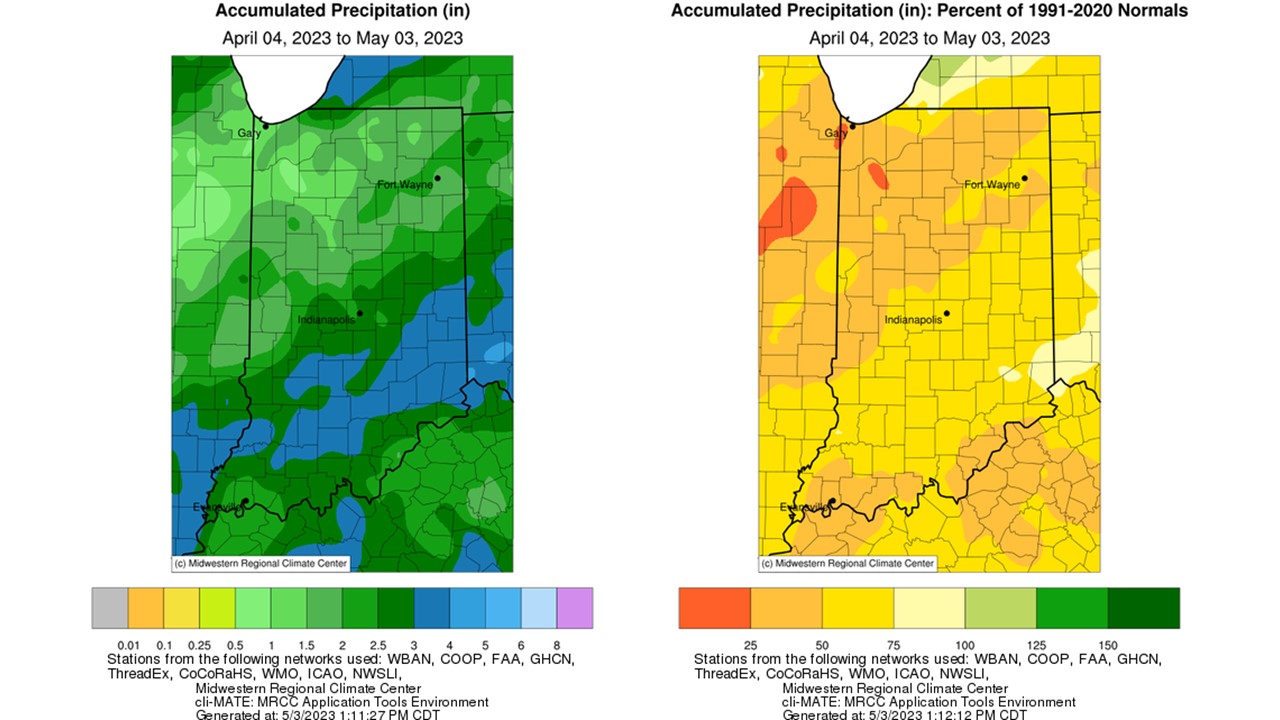
Figure 4: Interpolated map displaying accumulated precipitation for April 4-May 3, 2023 (left). Interpolated map displaying accumulated precipitation as a percent of the 1991-2020 climatological normal (right).
Rain forecast totals over the next seven days range between 0.10-2.00 inches statewide (Figure 5). Lightest totals appear fall in the northeast and heaviest totals are expected to be in southwestern Indiana. The Climate Prediction Center’s 6–10-day (Figure 6) and 8–14-day (Figure 7) temperature and precipitation outlooks indicate higher chances for above-normal temperatures and near-normal precipitation. The warmer temperatures will certainly be welcomed by all.
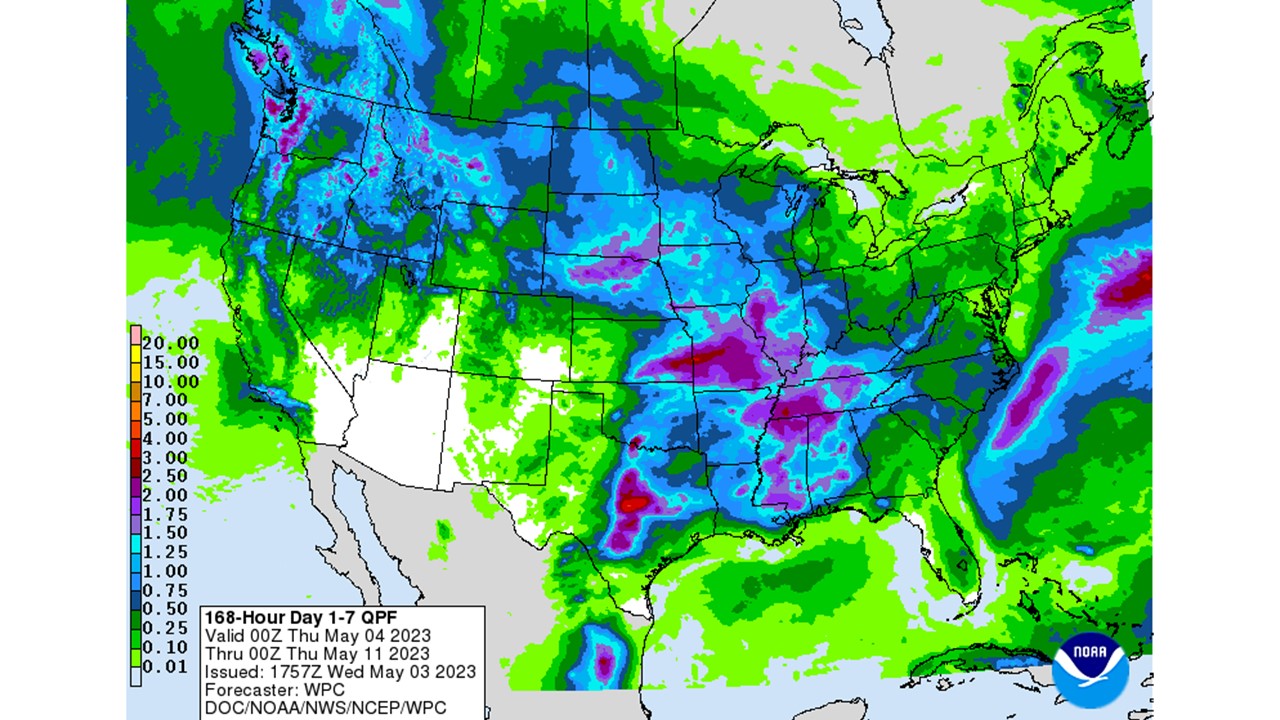
Figure 5: NWS Weather Prediction Center 7-day quantitative precipitation forecasts for the continental United States, valid May 4-May 11, 2023.
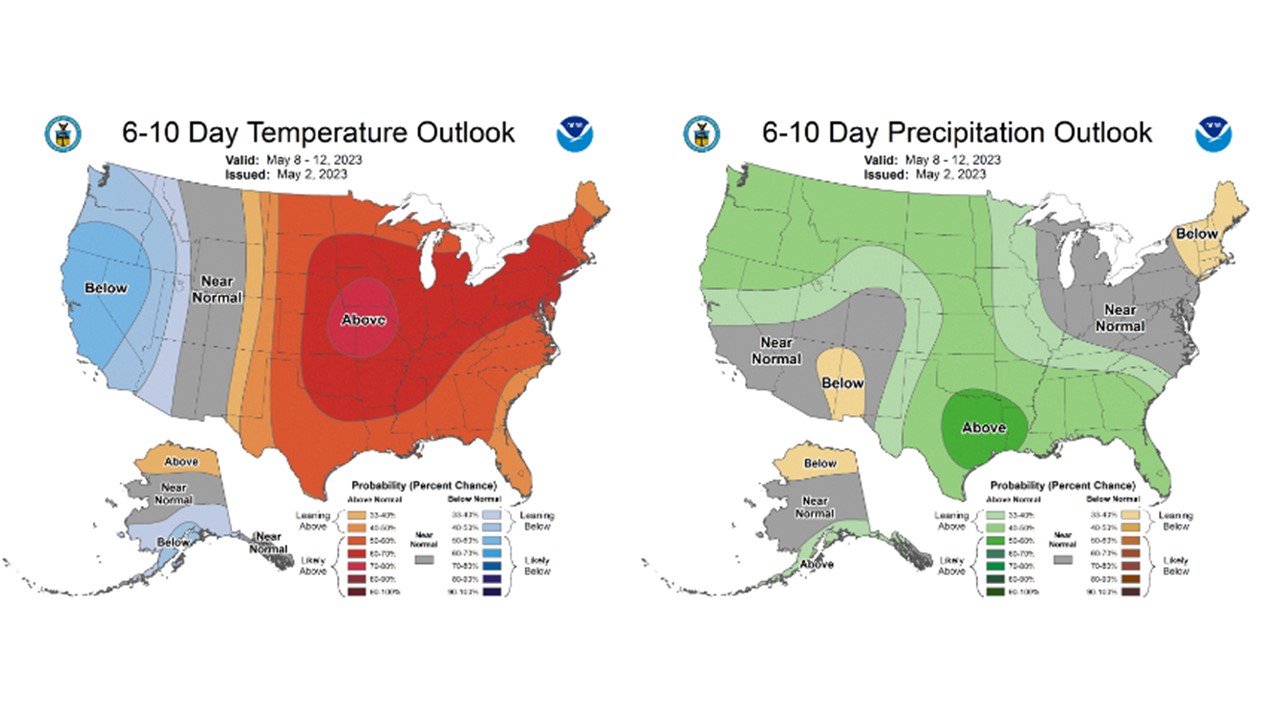
Figure 6: The CPC’s 6–10-day temperature and precipitation outlooks, valid for May 8-12, 2023.
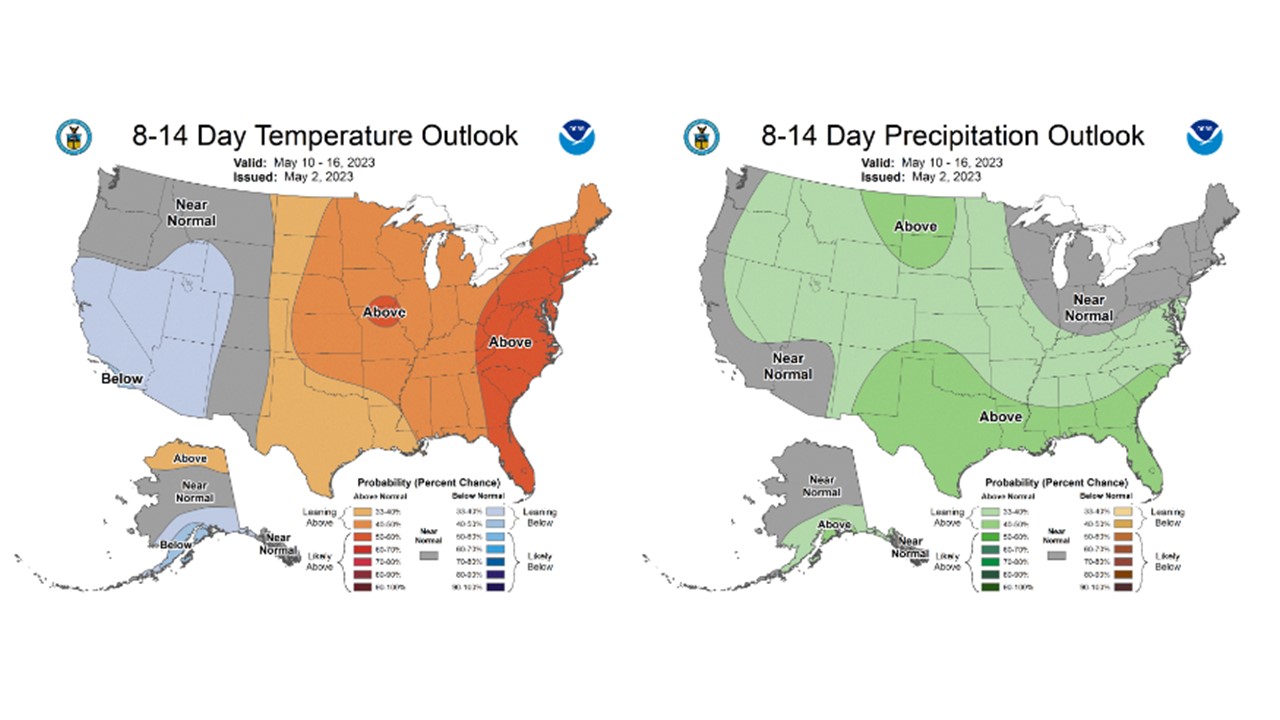
Figure 7: The CPC’s 8-14-day temperature and precipitation outlooks, valid for May 10-16, 2023.
