

The national Climate Prediction Center updates their monthly climate outlooks in the middle and last day of each month. The outlook for August that was released on July 31st provides too much uncertainty with respect to how temperatures might be (i.e., above normal, normal, or below normal), but the models are slightly favoring above-normal precipitation. Conditions across the state over the last few weeks have been on the drier side and evapotranspiration rates are high this time of year. Therefore, it is relatively common to have some drying across the state. Timing can be everything, though. If August does end up with above-normal precipitation, will it all fall on just a few days or spread out across the month? At this point, the 6-to-10-day outlook (August 10-14) is favoring above-normal precipitation and the 8-to-14-day outlook (August 12-19) is indicating normal rainfall for that time of the year. Hopefully, this will translate to a relative spread of precipitation events throughout the month that should lower the risk of significant drought conditions developing.
Temperatures are strongly favored to be above normal for the first few weeks of August. There are early indications of potential risks of extreme temperatures near the middle of the month (Figure 1). Climatologically speaking, Indiana usually experiences its hottest day of the year in early July (Figure 2). It is looking as if this year may not be fit into that climatological average! Figures 3 and 4 show modified growing degree-day accumulations and comparisons to recent years.
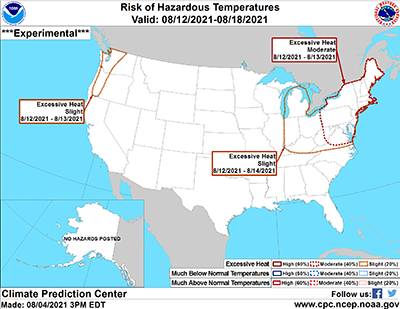
Figure 1. Predicted risk of hazardous temperatures as of 4 August 2021.
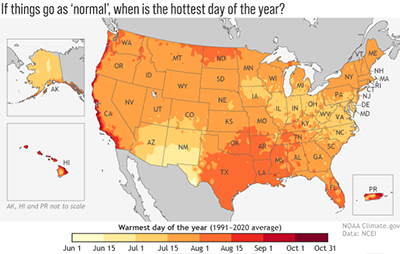
Figure 2. The average warmest day of the year based upon data from 1991 through 2020.
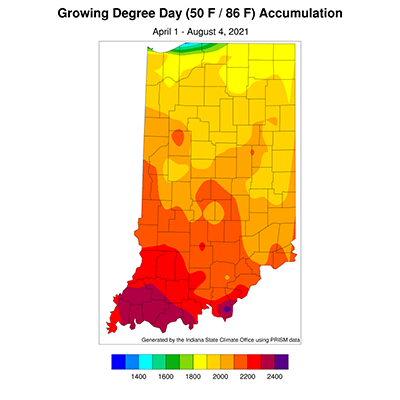
Figure 3. Modified growing degree day accumulations from April 1 to July 28, 2021.
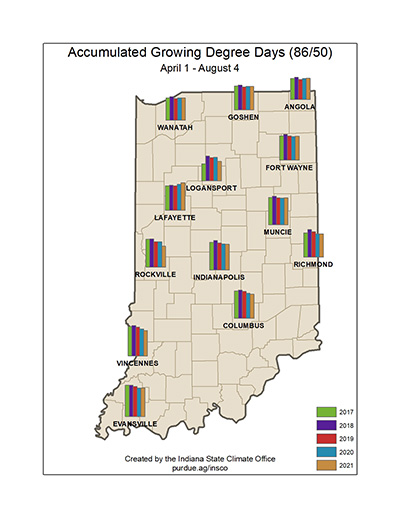
Figure 4. Comparison of 2021 modified growing degree day accumulations from April 1 – August 4 to the past four years.
