

As the days (and nights) have been getting cooler, I wanted to share with you a new online tool that the Midwestern Regional Climate Center (MRCC) has developed that provides an interactive way to learn more about the climatology of the first fall and last spring freeze dates across our region. This Freeze Date Tool (https://mrcc.purdue.edu/freeze/freezedatetool.html) incorporates historical temperature data that has been aggregated to the county level back to 1950. Users can select a freeze temperature threshold from 20 degrees Fahrenheit (F) up to 40 degrees F and see the earliest, average, and latest dates when the first fall event and last spring event occurred (see Figure 1 for an example). Additionally, users can view the annual variability and trends of these dates as well as the length, variability, and trend of the growing season over time. When a user clicks on a county, there are several other features that can be viewed such as tables of historical dates, time series plots for different temperature thresholds, and the ability to download summary information. For example, Figure 2 presents box plots that illustrate the range of dates per decade when the first fall freeze (defined at 28 degrees F) occurred per decade. The wider the box (and lines extending from each box) the greater the variability of first fall freeze dates for that decade. This example plot is for Clinton County, Indiana and it shows that in the 1970s and 1980s, there was large inter-annual variability of when the first fall freeze occurred. However, in the 1950s and 2010s, that variability is less with date of the first fall freeze occurring later in the calendar year in recent years. While it is too soon to predict when the first hard freeze will occur this year for each county in Indiana, a tool like this can help give an idea of what has been occurring over the past 70 years and more informed guesses could be made. For example, in the 2010s in Clinton County, the first hard freeze never occurred earlier than October 18th, the median date was October 31st, and the latest that first hard freeze occurred was November 12th (in 2016).
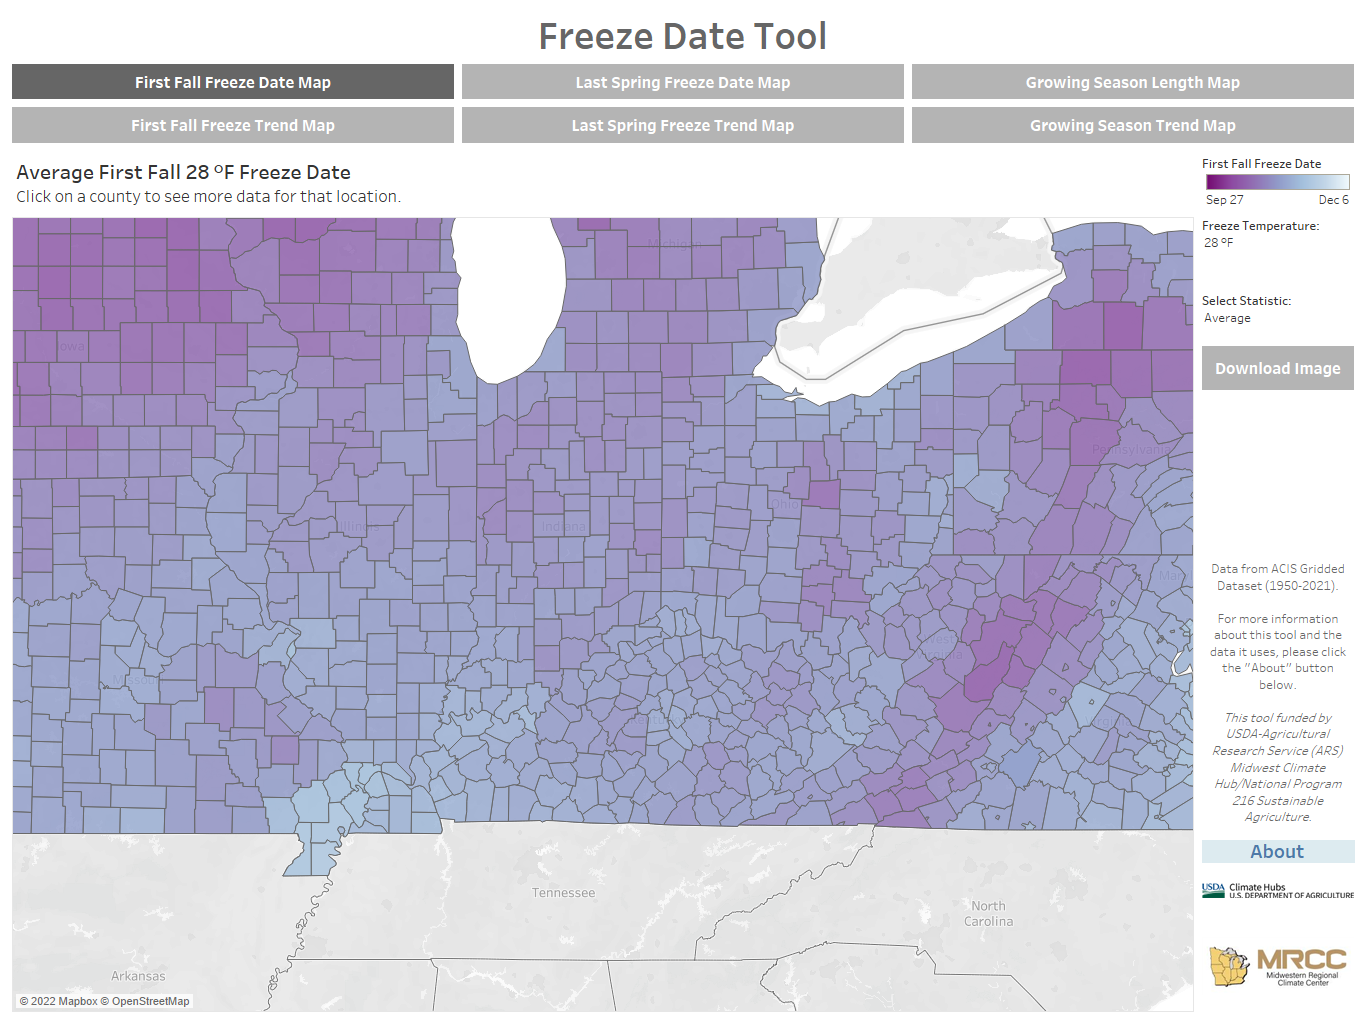
Figure 1. Example map from the MRCC’s Freeze Date Tool that shows the average date of the first fall freeze defined at the 28 degrees Fahrenheit threshold.
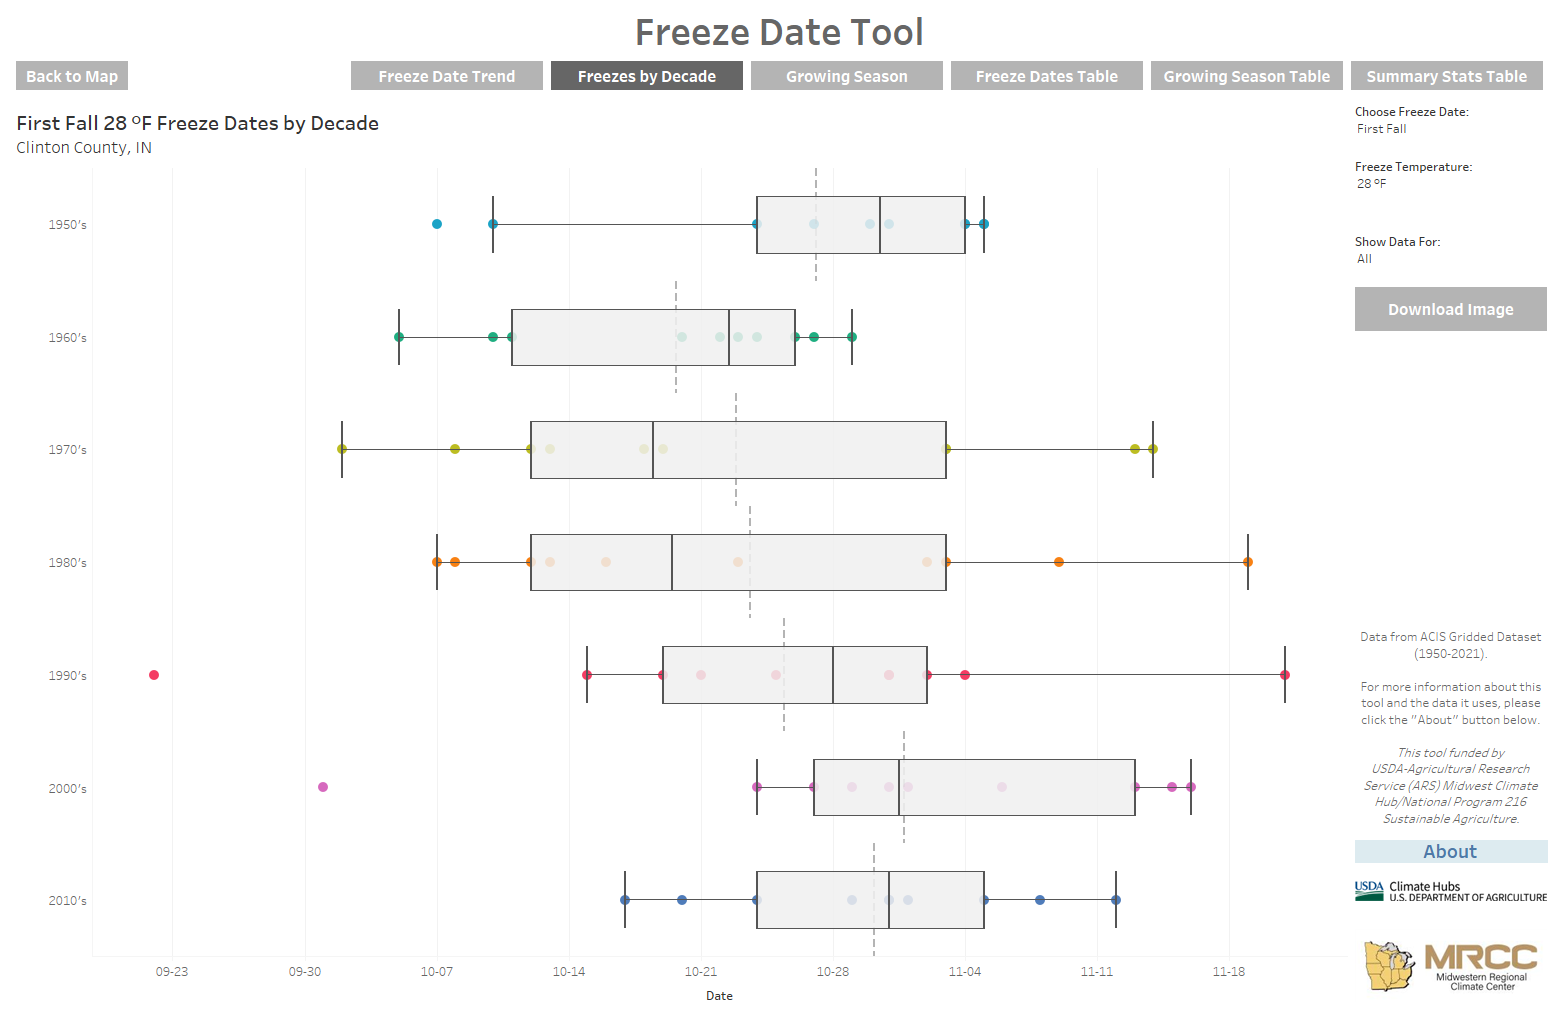
Figure 2. Example product from the MRCC’s Freeze Date Tool that shows the variability and range of date for the first fall freeze in Clinton County, Indiana defined at 28 degrees Fahrenheit.
In other climate news, abnormally dry conditions are still lingering in the northern counties of Indiana (Figure 3). There has been very little precipitation across the state over the past week, but with the cooler temperatures and vegetation preparing for harvest or winter dormancy, there has also been less water demand. Therefore, drought impacts have been minimal. Less-than-normal precipitation is favored to continue into October with higher probabilities of above-normal temperatures. Therefore, it is quite likely that drought impacts will become more noticeable, and a larger portion of Indiana will be in at least some category of the U.S. Drought Monitor.
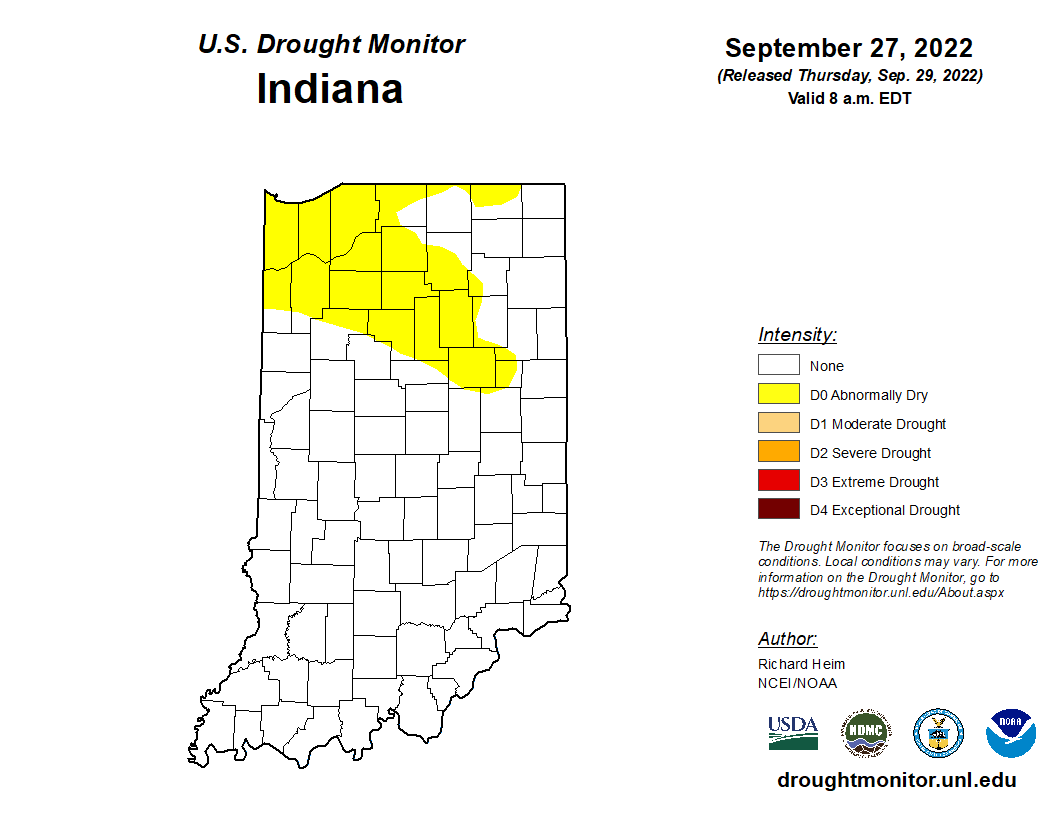
Figure 3. U.S. Drought Monitor for data through September 27, 2022.
As the warm season winds down, accumulated modified growing degree days are starting to level off. Figures 4 and 5 show the total accumulations since April 15th this year along with the departure from the 30-year climatology.
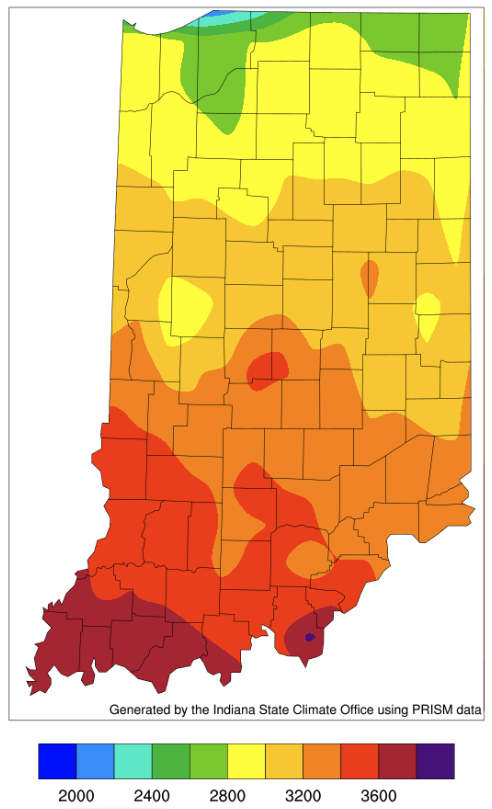
Figure 4. Modified growing degree day (50°F / 86°F) accumulation from April 15-September 27, 2022.
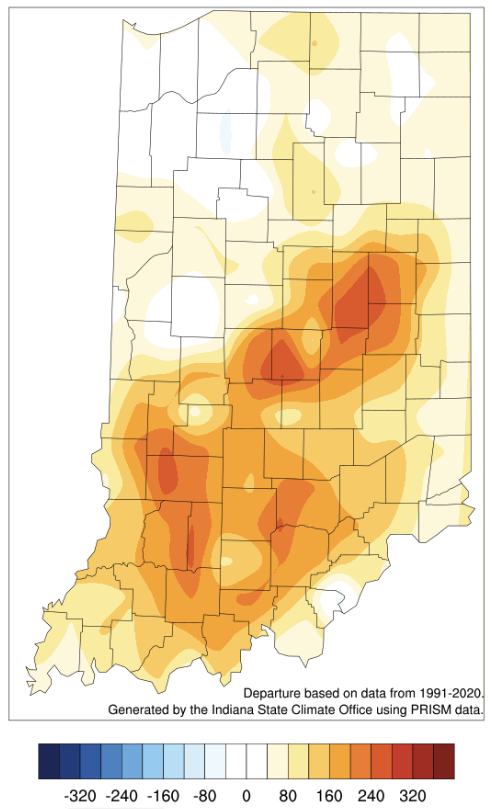
Figure 5. Modified growing degree day (50°F / 86°F) accumulation from April 15-September 27, 2022, represented as the departure from the 1991-2020 climatological average.
