

The 2023-2024 meteorological winter (December, January, and February) has concluded, but it seems as if we only experienced a couple weeks of winter-like weather this season. Indiana’s average temperature was 35.8°F, which was 5.3°F above normal. This was good for Indiana’s second warmest winter since records began in 1895. The warmest winter on record was 1931-1932 with an average temperature of 37.4°F, an astonishing 1.6°F warmer than this winter. As for the Midwest, it was the warmest winter on record (32.7°F). Interestingly, it was the first time on record that the winter temperatures averaged above the freezing mark.
Indiana’s winter precipitation was nearly normal totaling 8.26 inches (0.18 inches below normal). The bigger story was the lack of snowfall as the majority of the state ran 5-10 inches below normal, and in some cases 10-25 inches below normal, for the winter (Figure 1). The Midwestern Regional Climate Center’s Accumulated Winter Season Severity Index (AWSSI) objectively quantifies the relative severity of the winter season by accounting for the intensity and persistence of cold weather, the amount of snow, and the amount and persistence of snow on the ground. Most of the Midwest, like Indianapolis, experienced near record mild conditions this winter (Figure 2).
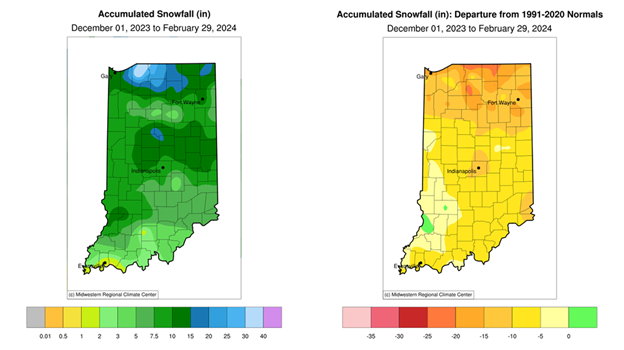
Figure 1: Left – Winter 2023-2024 snowfall totals from December 1 – February 29. Right – Winter 2023-2024 snowfall totals represented as a departure from the 1991-2020 climatological average snowfall.
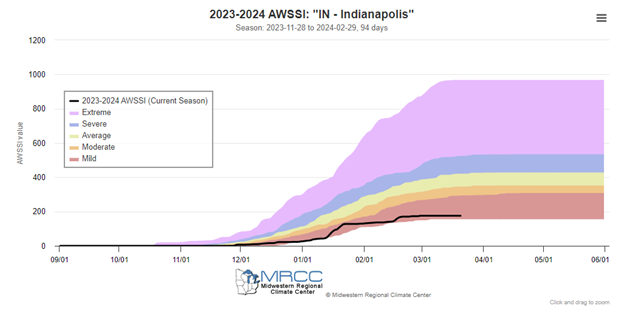
Figure 2: MRCC’s AWSSI for Winter 2023-2024 for Indianapolis, IN. This winter has been a near-record mild winter for Indianapolis.
On a positive note, drought conditions have improved throughout the winter (Figure 3). In December, over 44 percent of the state was in moderate drought (D1). Drought monitor conditions improved throughout the winter, as all that remained at winter’s end was abnormally dry (D0) conditions in central and southern Indiana.
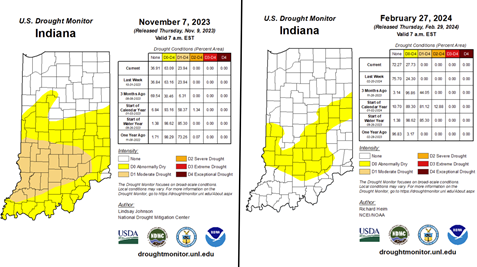
Figure 3: Left – US Drought Monitor from December 5, 2023. Right – US Drought Monitor from February 27, 2024.
As for more recent conditions, the first 27 days of March have continued to run 6.3°F above the 1991-2020 climatological average. We have had some impressive precipitation totals in the first week of March as Adams and Daviess Counties measured around 3.75 inches in the first week of the month. Heavy precipitation totals were rather localized, as portions of central and southern Indiana recorded below-normal precipitation (Figure 4). Since February, though, precipitation totals have been less than 75 percent of normal for central and southern Indiana. Abnormally dry conditions in this week’s US Drought Monitor are expanding in southern Indiana as a result (Figure 5).
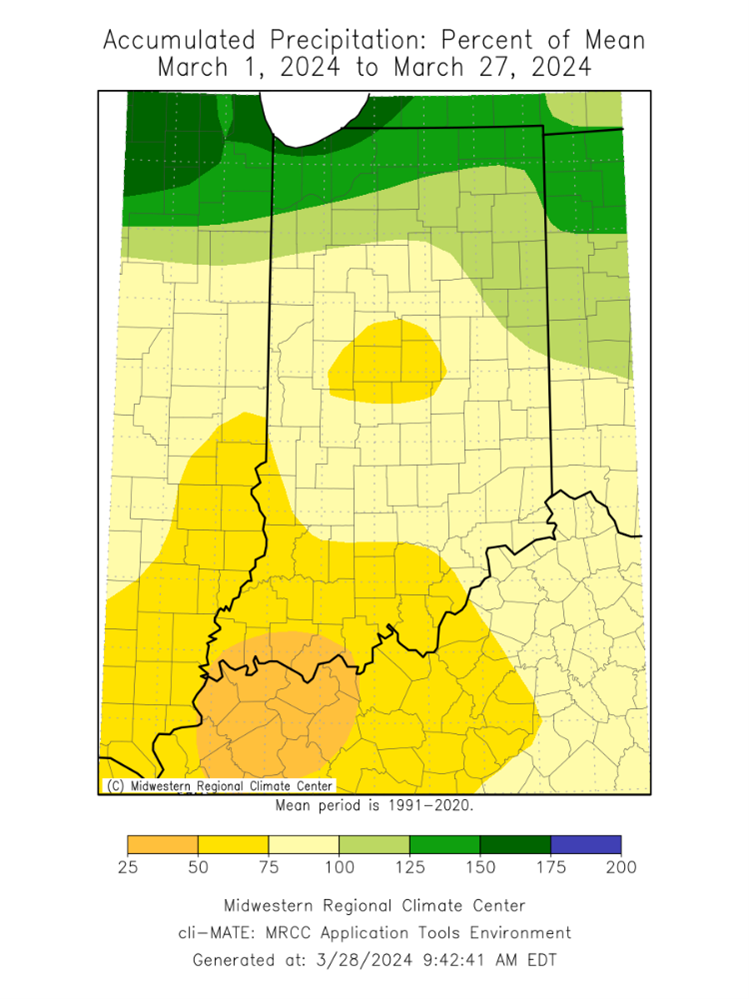
Figure 4: March 1-27, 2024 accumulated precipitation represented as a percent of the 1991-2020 climatological average.
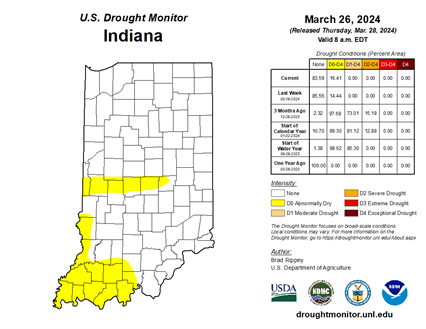
Figure 5: US Drought Monitor – Indiana Map, released March 29, 2024.
Rain forecast totals range from just under an inch (southern Indiana) to just over 2 inches (northern Indiana) from March 28-April 4, much of which is needed (Figure 6). Whether this actually happens is to be determined. The Climate Prediction Center (CPC) has slightly elevated chances of below-normal temperatures and increased confidence in below-normal precipitation from April 2-6. April 4-10, the CPC has higher confidence in above-normal temperatures and above-normal precipitation. If you missed Hans Schmitz’s Indiana spring 2024 climate outlook, titled “Kiss from a Rose on El Nino’s Grave”, be sure to check it out.
Figure 6: NOAA’s quantitative precipitation forecast for March 28-April 4, 2024.
