

Highlighter green soybeans (N-deficient) are related to the root system, number of nodules, and nodule activity (i.e., evidence of N fixation). Figures 1, 2, and 3 show the whole plant, roots, and nodule loads that are related to the healthy vs. N-deficient soybeans. The vast majority of these N-deficient soybeans are related to soils that have been saturated periodically throughout the growing season (see last week’s articles and this one).
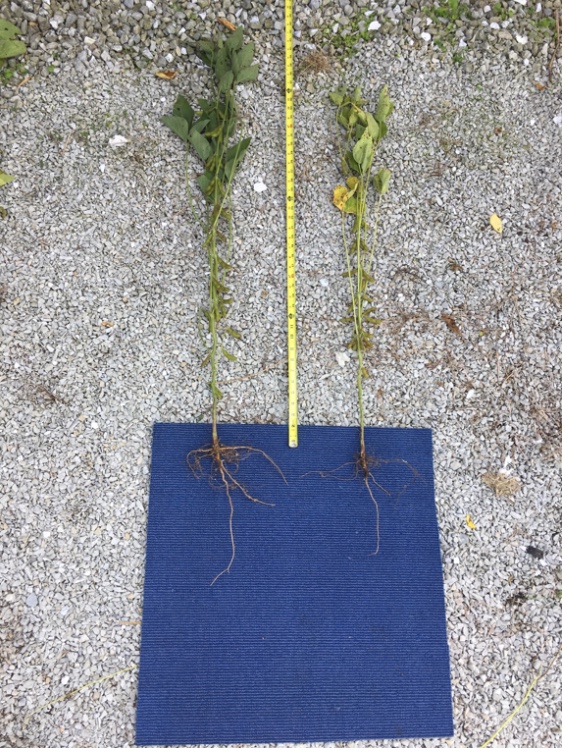
Figure 1. Representative plants that had adequate supply of N (left) and those that were deficient in N (and S). August 31, 2018 in Shelby County.
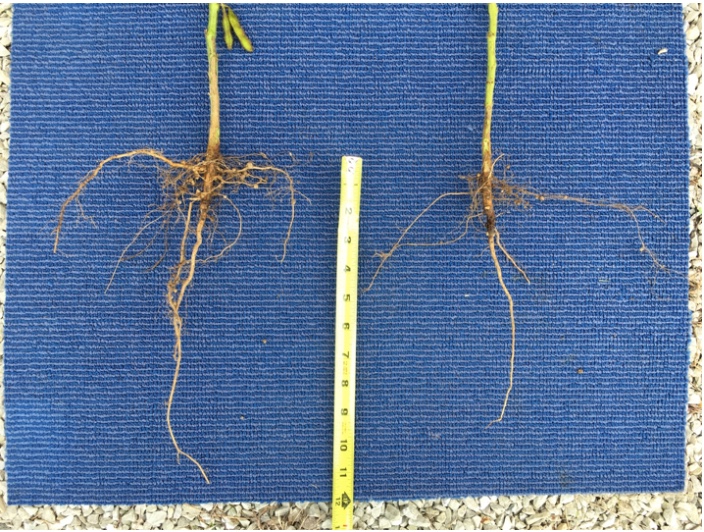
Figure 2. The root system of the healthy soybean (left) are more extensive with more nodules and greater nodule activity (i.e., pink interior that indicates N fixation). N-deficient soybean on the right has smaller root system (diameter of roots, evidence of root hairs, depth of taproot), very few nodules, and nearly no evidence of active N fixation. August 31, 2018 in Shelby County.
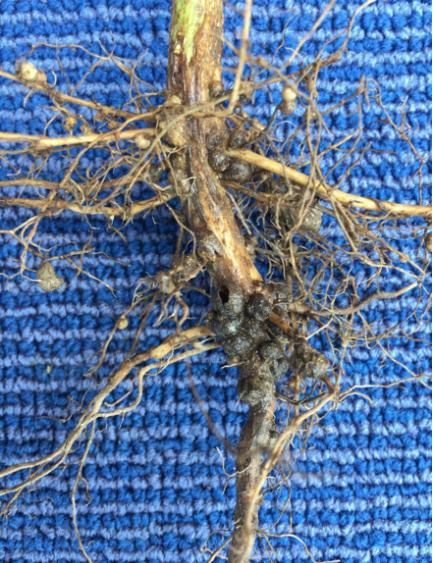
Figure 3. Poor nodulation and limited N fixation on the N-deficient soybeans. Oldest nodules (the ones initiated during seedling development) are dead and young nodules are limited in number and activity due to saturation conditions periodically throughout the growing season. August 31, 2018 in Shelby County.
In last week’s articles, we described seep hydrology to explain why these highlighter green soybeans were showing on the side slopes. Other fields are demonstrating the highlighter green soybeans (Figures 4 and 5) that are not related to seep hydrology. Anything that has been affecting rooting and therefore, nodulation and N fixation can be the culprit. Many of these fields are still related to wet feet via compaction or other soil characteristics that influence water flow and water holding capacity. Figures 6 and 7 show and describe the soil profiles of the dark green, soybeans vs. highlighter green soybeans. My preliminary thoughts are related subsoil depth and water holding capacity to name a few.
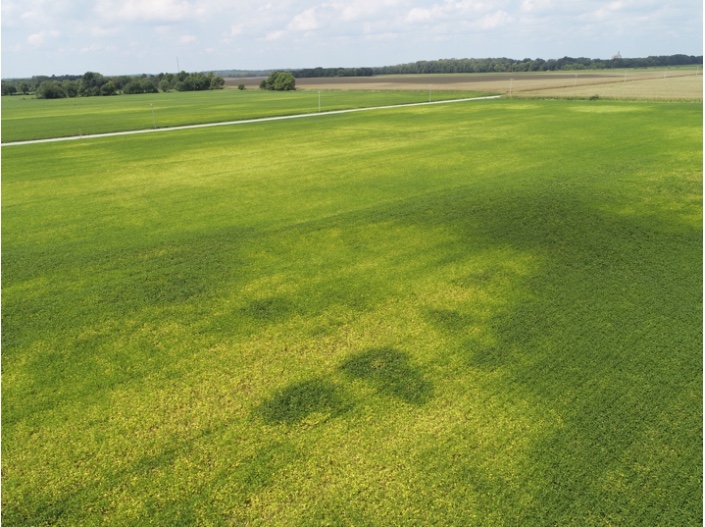
Figure 4. Aerial image of highlighter green soybean to yellow (now, senescencing) soybeans in Shelby County. August 31, 2018.
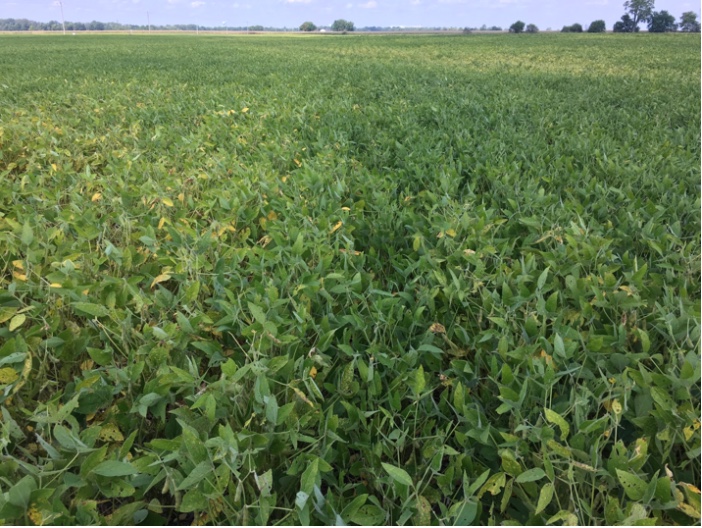
Figure 5. Field level picture of the transition from dark green, healthy soybeans to the highlighter green and yellowing soybeans. August 31, 2018 in Shelby County.
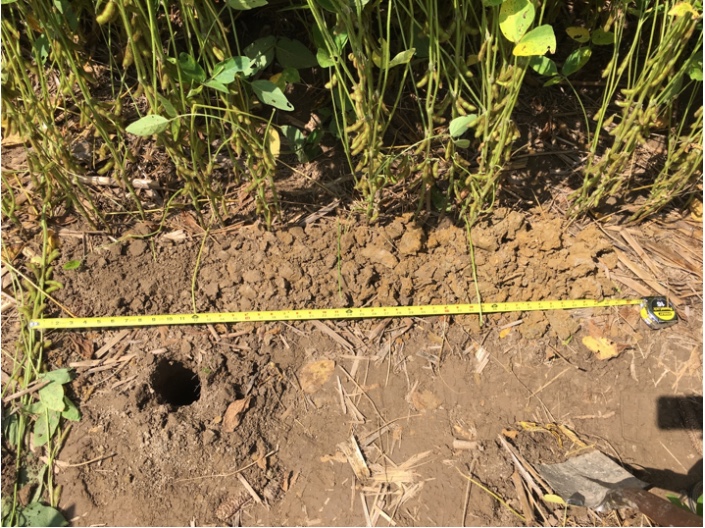
Figure 6. Soil profile to a depth of 48” in the middle of dark green, healthy soybeans. The petioles are laid across the approximate soil layers. The depth of this soil was deeper than 48” as I did not hit a restricting layer. August 31, 2018 in Shelby county.
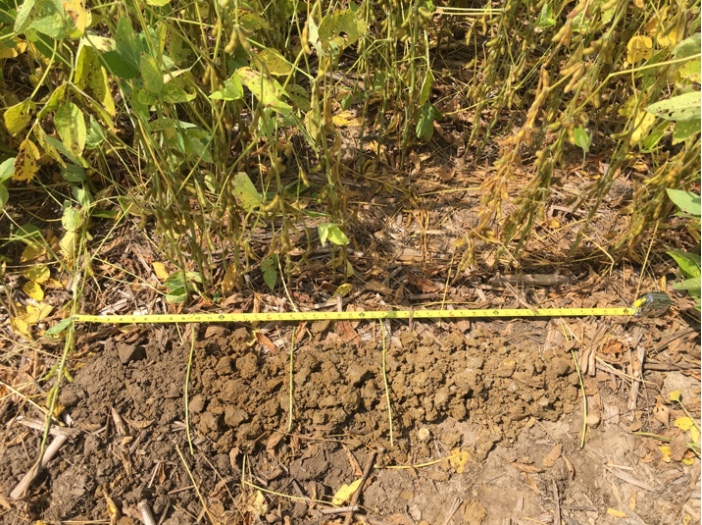
Figure 7. Soil profile to a depth of 42” in the middle of highlighter green to yellowing (senescence) soybeans. The petioles are laid across the approximate soil layers. Evidence of saturated conditions were seen higher in the profile: manganese concretions ~15” depth, gleying in the middle of the profile, and saturated/sticky soil at ~30”. Gravel and rocks were showing up at 24”, which then prevented any further boring beyond 42”. August 31, 2018 in Shelby county.
Limited N supply to soybean has a drastic effect on growth, development, and yield potential. Obviously, leaf nutrient concentrations (N and S in particular) will be different between the good and the bad areas. The leaf nodal development and branching will be limited thus, creating a short, compact plant. As the N deficiency continues, the plants will abscise the older leaves (lower portion of the soybean canopy) and progress upward (Figure 8). Pod retention and seed fill will be reduced as well. In Figure 8, you will notice fewer branches, shorter plants (i.e., fewer nodes), and fewer pods on the bottom of the plant. The N-deficient plants will also senescence faster/earlier than the healthy soybeans, especially at the two ends of the temperature spectrum: very hot (upper 80s and higher) or cool nights in the 50s.
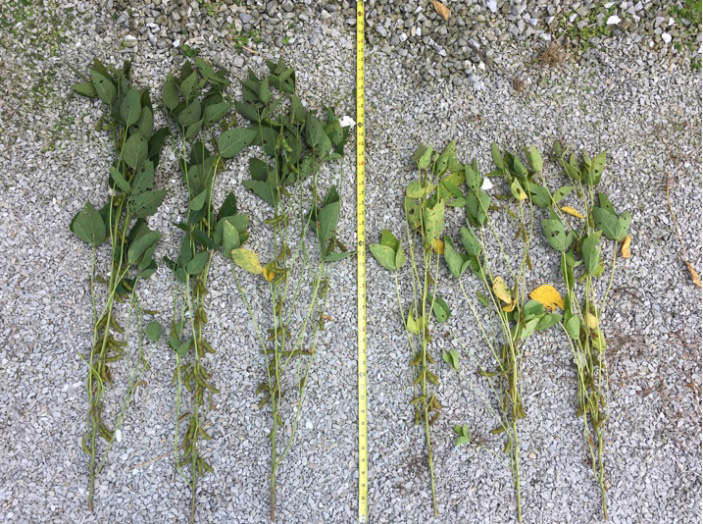
Figure 8. Representative plants that had adequate supply of N (left) and those that were deficient in N (and S). Yield estimate of 65 bu/ac (left) vs. 40 bu/ac (right). August 31, 2018 in Shelby County.
Stresses like N deficiency, limited water supply, and/or high temperatures also impact seed fill. The rate of seed fill and duration of seed fill are two of the major effects, but plants can also straight-out only produce 1- or 2-bean pods and/or arrest seed development (i.e., flat bean pods, 1- or 2- bean voids in a 3-bean pod) (Figures 9 and 10).
The yield effect of N deficiency can be quite severe. I collected the representative samples (1/10,000th acre) in the dark green, healthy soybeans and the highlighter green soybeans (not even the worse portions of the field) to estimate yield. My conservative estimate was 65 bu/ac for the healthy soybeans vs. 40 bu/ac for the highlighter green soybeans (Figure 8). The swing in yield production differences could be even greater depending on the final seed fill duration and rates. The N-deficient soybeans had more 2-bean pods and will likely have smaller seeds when is all said and done.
I want to raise the issue to your attention so you will be aware, so that you can still document these areas spatially before the combine comes into the field and averaging it across the header that is 25 to 40-ft wide. Yield maps can document some of these differences, but they will not have this level of resolution especially if the pattern is not matching side slopes or soil series.
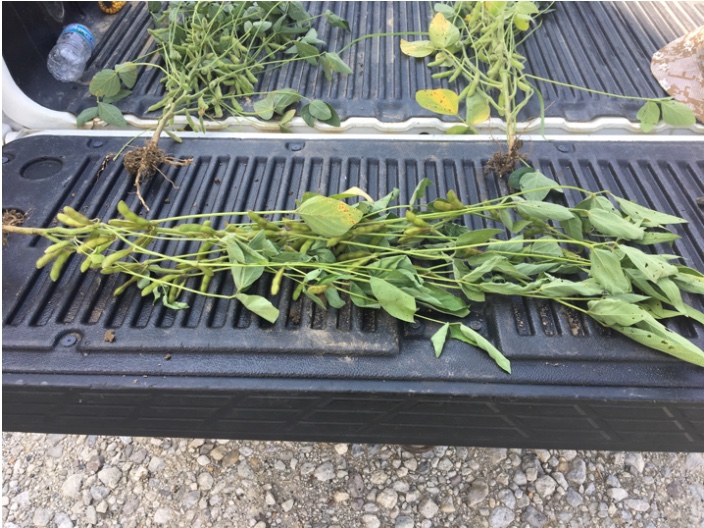
Figure 9. Dark green, healthy soybean with good root system and nodulation (upper left) vs. N-deficient soybeans (off-green and yellowing leaves) with poor root system and nodulation (upper right). Photo courtesy of Denny Cobb, Becks Hybrids. August 28, 2018 near Warsaw, IN.
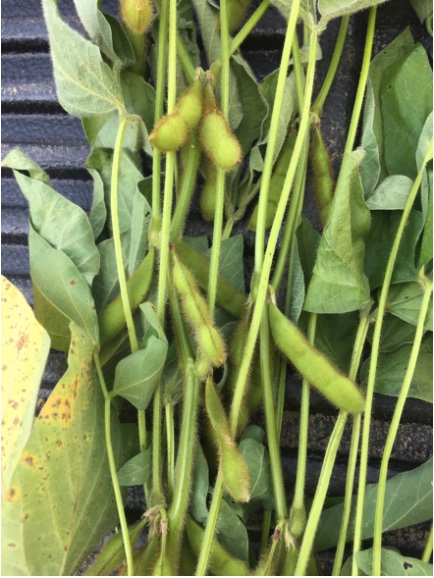
Figure 10. Two-bean pods and arrested seed fill (1- or 2- bean voids in a 3-bean pod) from the N-deficient soybeans pictured in Figure 6. Photo courtesy of Denny Cobb, Becks Hybrids. August 28, 2018 near Warsaw, IN.
