

Temperatures throughout the state remained pleasant, but low temperatures briefly dipped into the upper 30s and low 40s as a strong cold front pushed through the Midwest. Through the first 23 days of May, Indiana average temperatures were 0.3◦F above normal (Figure 1). Climate Divisions 1 and 7 had the largest departures, which were 0.9◦F and 1.1◦F above normal, respectively. Since April 1, growing degree days (GDD) have accumulated between 250 and 650 units (Figure 2, left). GDD accumulations were below normal through the south and eastern Indiana and were above normal in central and northwestern Indiana (Figure 2, right).
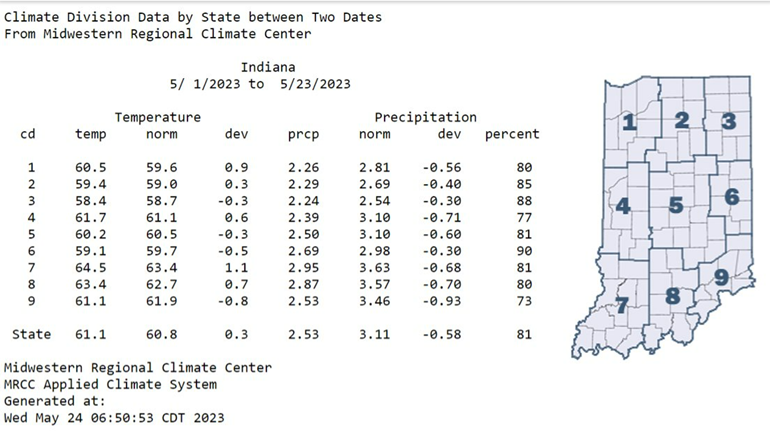
Figure 1: Indiana climate division and state temperature, normal temperature, temperature departure from normal, precipitation, normal precipitation, precipitation departure from normal, and percent of mean precipitation for May 1-23, 2023.
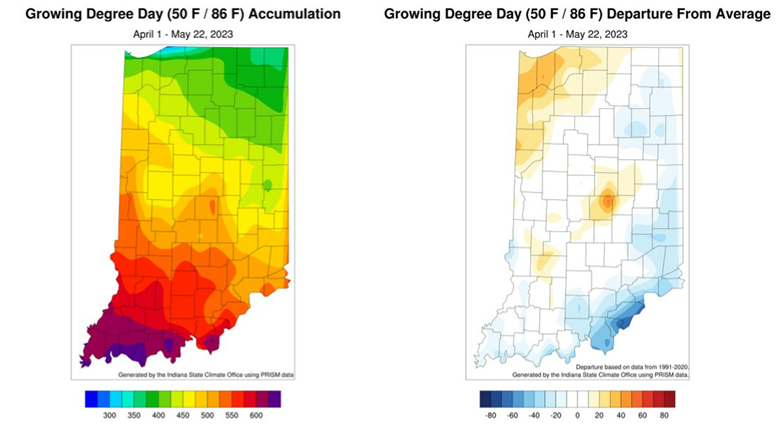
Figure 2: Total Accumulated Indiana Modified Growing Degree Days (MGDDs) April 1-May 22, 2023 (left) and Total Accumulated MGDDs represented as the departure from the 1991-2020 climatological normal (right).
Precipitation trended increasingly below normal for the first 23 days of May, as no Climate Divisions recorded above normal totals (Figure 1). Climate Divisions 3 and 6, both located in eastern Indiana, received the closest to normal precipitation totals this month (88 and 90 percent of normal, respectively). Since April 25, only a small pocket near Fort Wayne and a cutout of Wayne and Randolph counties measured above-normal precipitation (Figure 3, right). Much of the recent rain can be attributed to lingering precipitation along the cold front that extended through the southern Midwest on May 20. The dryness experienced throughout the state brought expansion of abnormally dry conditions in the May 25 US Drought Monitor, which included 8.11 percent more area than last week (Figure 4). The May 22 Indiana Crop Weather Report indicated that both corn and soybean planting and emergence remain above the 5-year average; 77 percent of corn and 72 percent of soybeans have been planted.
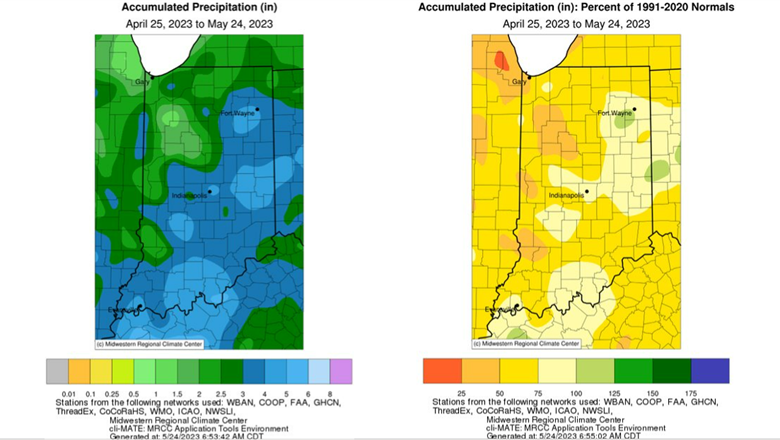
Figure 3: Interpolated map displaying accumulated precipitation for April 25-May 24, 2023 (left). Interpolated map displaying accumulated precipitation as a percent of the 1991-2020 climatological normal (right).
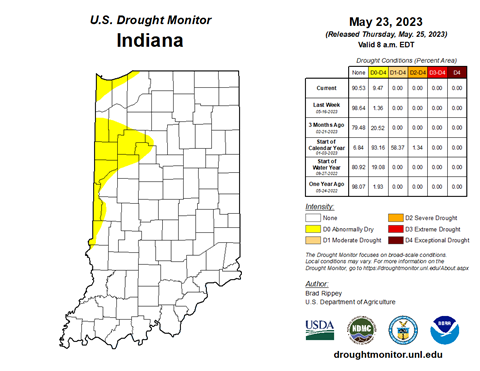
Figure 4: May 23, 2023, US Drought Monitor. The US Drought Monitor is released every Thursday morning by 8:30 AM.
Dry conditions will continue into the near future, as the 7-day precipitation forecast has the entire state missing out on rain (Figure 5). The Climate Prediction Center’s 6-10 (Figure 6) and 8–14-day (Figure 7) temperature outlooks both show more than likely chances for above-normal temperatures and below-normal precipitation. These warm and dry conditions will likely worsen drought conditions over the coming weeks. Throughout the summer season, the Climate Prediction Center’s seasonal outlooks have equal chances of above and below normal temperatures in Indiana and is leaning towards above-normal precipitation (Figure 8).
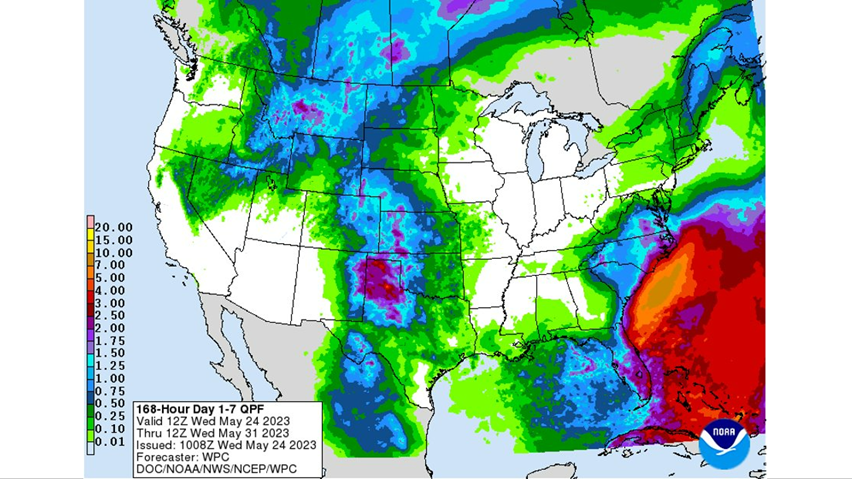
Figure 5: NWS Weather Prediction Center 7-day quantitative precipitation forecast for the continental United States, valid May 24-May 31, 2023.
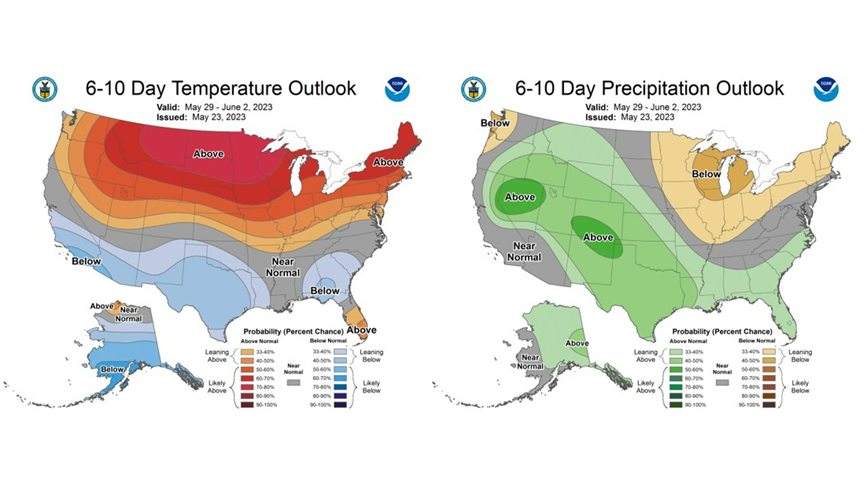
Figure 6: The CPC’s 6–10-day temperature and precipitation outlooks, valid for May 29 through June 2, 2023.

Figure 7: The CPC’s 8–14-day temperature and precipitation outlooks, valid for May 31 through June 6, 2023.
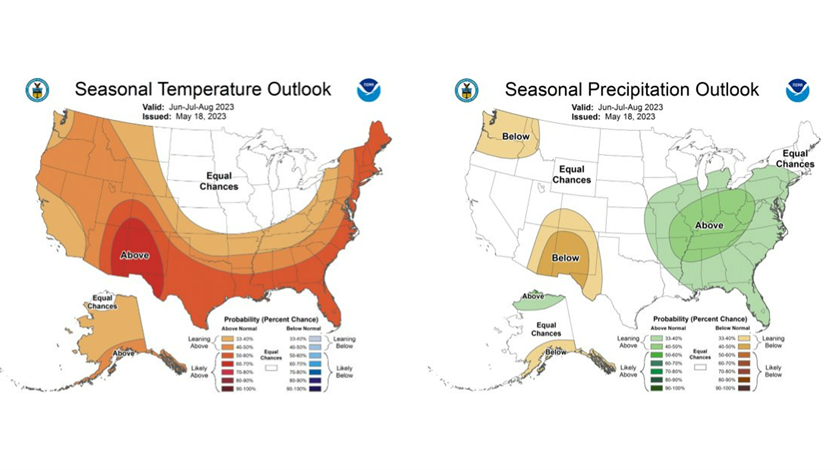
Figure 8: The CPC’s Seasonal temperature and precipitation outlooks, valid for June, July, and August 2023.
