

- Fact: Corn and soybean planting equipment is larger than 25 years ago.
- Fact: Individual farmers can plant more acres per day than 25 years ago.
- Yet, total maximum weekly planting progress has changed little over 25 years.
The number of 30-, 40-, and 60-ft wide (or larger) field crop planters across the U.S. Midwest is greater today than, say, 25 years ago. Certainly, individual farmers can plant more acres of corn and soybean per day with today’s large field equipment than they could 25 years ago. Consequently, it seems logical that planting season delays can be overcome by the capability of today’s modern planters to plant a greater percent of the state’s crop per week when “push comes to shove.”
As is often the case with “logical conclusions”, the historical data do not necessarily support the logic. Historical planting progress data suggest that the maximum number of acres of corn and soybean planted per week in Indiana has not changed much over the past 25 years. The accompanying figures illustrate the number of acres and percent of total acres planted during the respective weeks of maximum planting progress for corn (Fig. 1), soybean (Fig. 2), and the two crops combined (Fig. 3) for Indiana during the past 25 years.
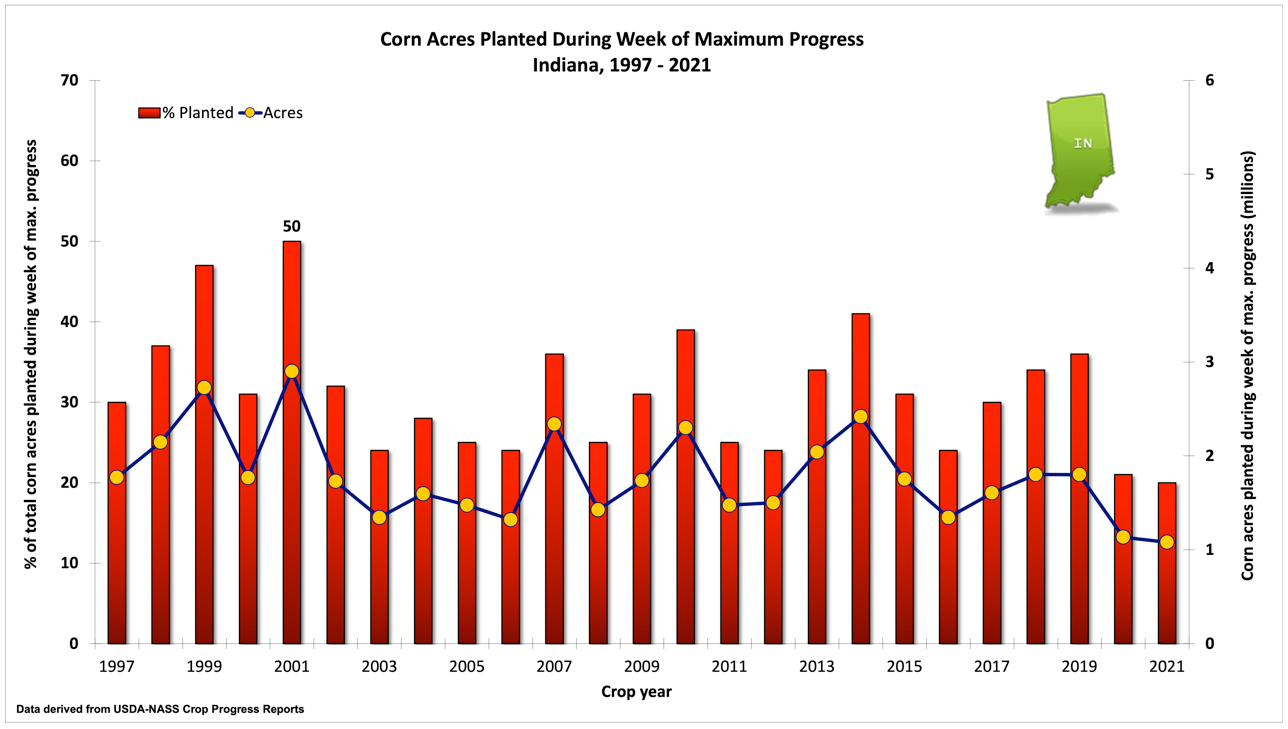
Fig. 1. Acres (actual and percent of total) of field corn planted during the week of maximum planting progress in Indiana, 1997-2021. Derived from USDA-NASS crop reporting data. Note that the exact weeks of maximum corn planting progress may not be the same weeks as those of maximum soybean planting progress.
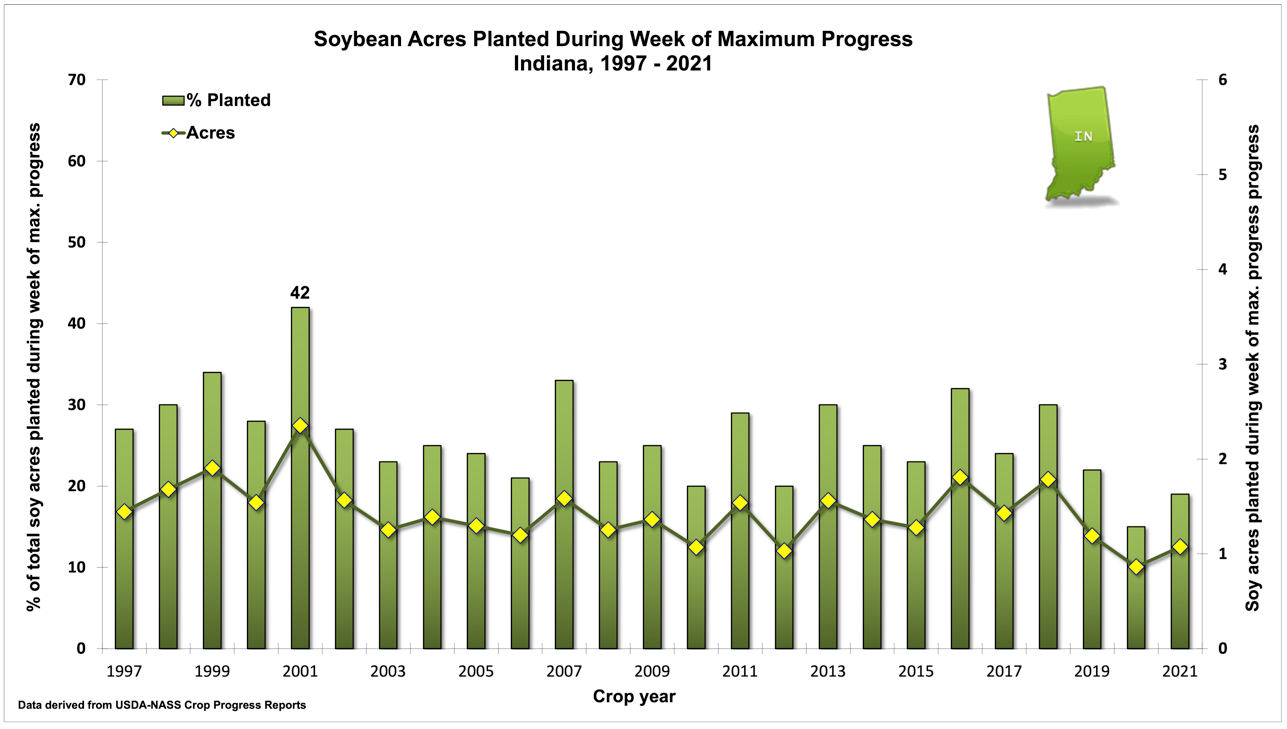
Fig. 2. Acres (actual and percent of total) of soybean planted during the week of maximum planting progress in Indiana, 1997-2021. Derived from USDA-NASS crop reporting data. Note that the exact weeks of maximum soybean planting progress may not be the same weeks as those of maximum corn planting progress.
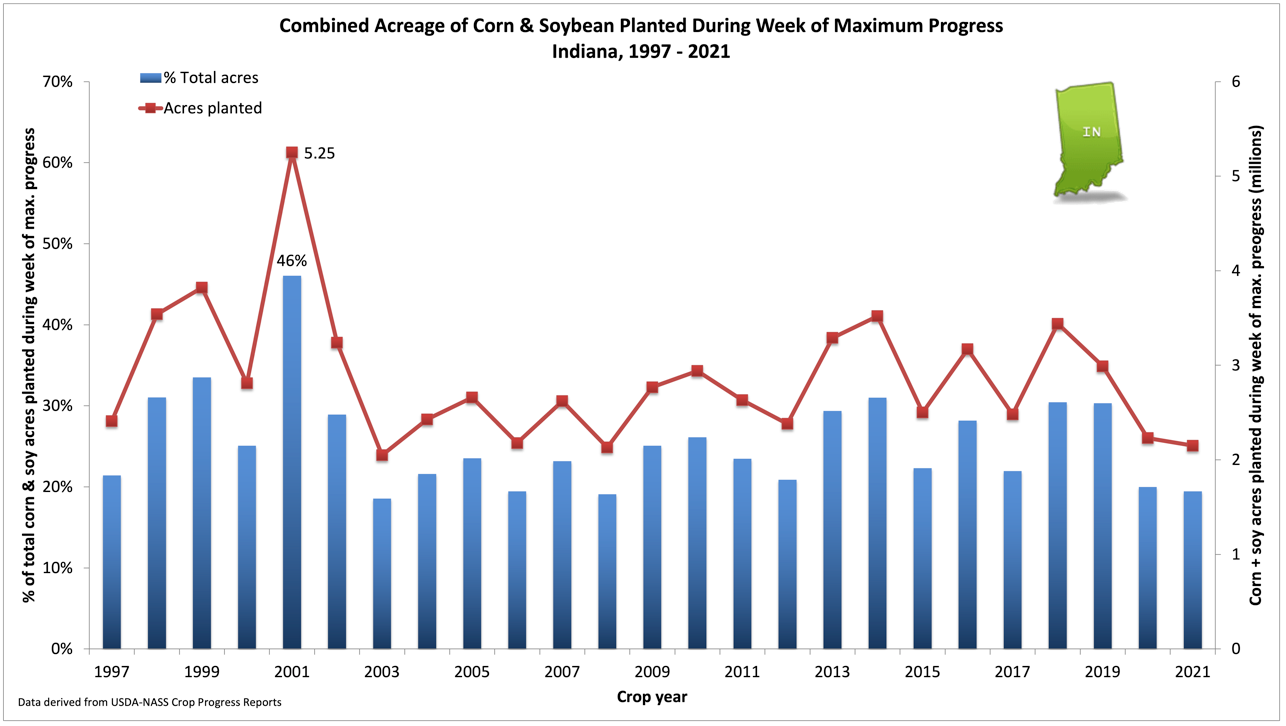
Fig. 3. Acres (actual and percent of total) of field corn plus soybean planted during the week of maximum total planting progress for both crops in Indiana, 1997-2021. Derived from USDA-NASS crop reporting data. Note that the exact weeks of maximum single crop progress may differ from the weeks of maximum two-crop progress.
The greatest number of corn acres planted in a single week in Indiana during the past 25 years occurred in 2001 when 2.9 MILLION acres or 50% of the total acreage for that year were planted in a single week (Fig. 1). Since 2001, the closest Indiana farmers have come to matching that progress was during the 2014 planting season, when 41% of the total crop or 2.4 million acres were planting during a single week.
The most soybean acres planted in a single week in Indiana during the past 25 years also occurred in 2001 when 2.4 million acres or 42% of the total acreage for that year were planted in a single week (Fig. 2). Since then, the closest Indiana farmers have come to matching that progress was during the 2016 planting season, when 1.8 million acres or 32% of the total crop were planted during a single week.
Looking at the historical planting progress of each crop individually (Fig’s 1 and 2) suggests that little improvement has been made in our ability to plant a lot of crop acres quickly. Some have countered that the potential TOTAL number of combined crop acres planted per week has increased because farmers are increasingly planting soybean at the same time as they are planting corn, when historically soybean planting occurred near the end of corn planting. Well, that turns out to be a bit of “fake news”, also.
During the past 25 years in Indiana, the greatest number of corn AND soybean acres planted in a single week was also 2001, when 5.25 million acres of the two crops were planted in a single week, or 46% of the total acres planted that year (Fig. 3). From a historical perspective, such an achievement over a week’s time borders on phenomenal. During the ensuing twenty years, Indiana farmers have not come close to matching that planting record. In fact, looking at just the 20 years since 2001 (Fig. 3), the maximum number of corn plus soybean acres planted in a single week has averaged 2.7 million acres, has been very erratic year to year, and shows no appreciable increase over time.
So, given the realities of ever larger planting equipment and the fact that farmers are frequently planting both crops at the same time these days, the conundrum is this… Why has the actual weekly planting progress of the two crops changed very little over the past 25 years? The answer does not appear to be related to changes in total crop acres planted in Indiana because that number has remained fairly constant in during that time period (Fig. 4).
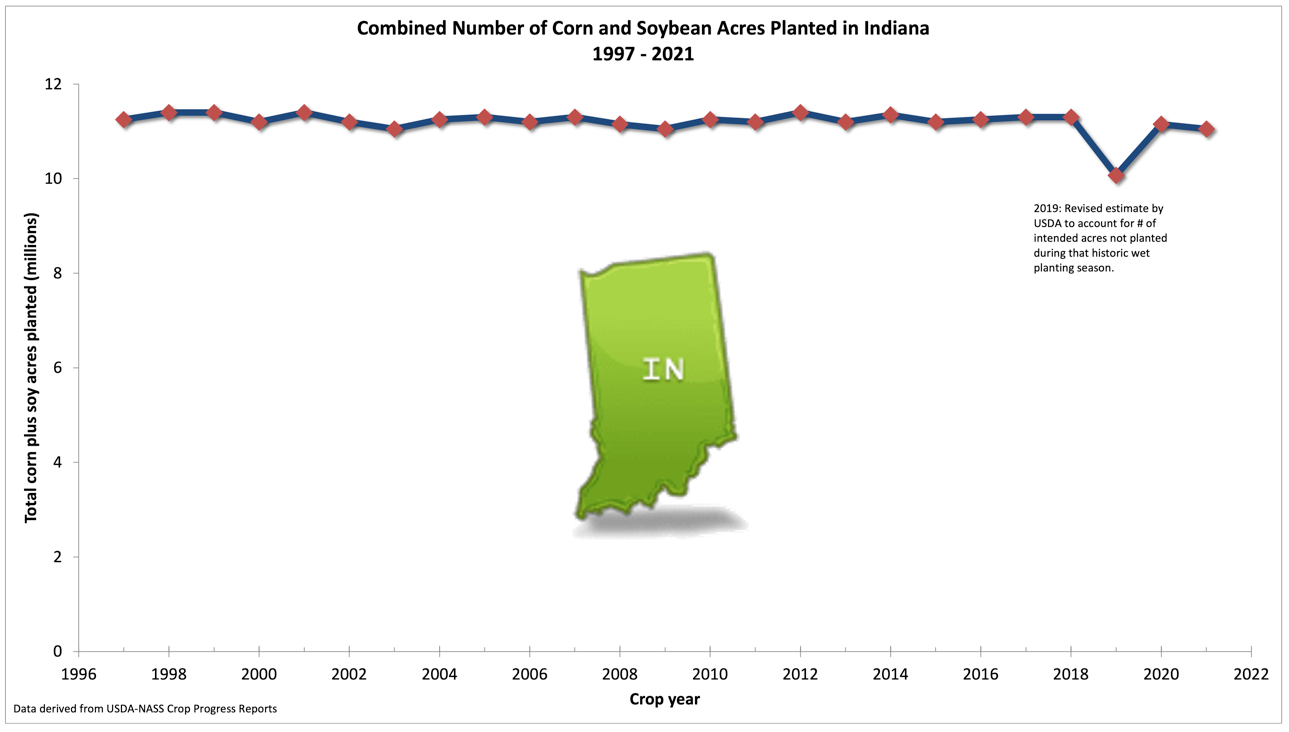
Fig. 4. Combined number of acres planted to corn and soybean in Indiana, 1997-2021. Derived from USDA-NASS crop reporting data.
One answer to the large planter vs. planting progress conundrum may be the fact that the number of corn and soybean growers in Indiana has decreased over time and those remaining are farming more acres than they did 25 years ago. Even though farm machinery is larger today and cover more acres per day than 25 years ago, fewer farmers are farming more acres and so total planting progress in terms of percent of total acres per week remains fairly unchanged. Coupled with that thought is the reality that weather and soil conditions dictate the number of days available during any given week for field work and planting. Several articles from Scott Irwin and Todd Hubbs at the Univ. of Illinois (2019, 2020a, 2020b listed below) provide more thoughtful insight in this line of reasoning.
Related reading
Irwin, Scott and Todd Hubbs. 2019. Here We Go Again: How Many Days Does It Take to Plant the U.S. Corn Crop? farmdocDAILY, Univ. of Illinois. https://farmdocdaily.illinois.edu/2019/04/here-we-go-again-how-many-days-does-it-take-to-plant-the-u-s-corn-crop.html [accessed Apr 2022].
Irwin, Scott and Todd Hubbs. 2020a. An Update on How Many Days It Takes to Plant the U.S. Corn Crop. farmdocDAILY, Univ. of Illinois. https://farmdocdaily.illinois.edu/2020/04/an-update-on-how-many-days-it-takes-to-plant-the-us-corn-crop.html [accessed Apr 2022].
Irwin, Scott and Todd Hubbs. 2020b. Further Evidence on the Time It Takes to Plant the U.S. Corn Crop. farmdocDAILY, Univ. of Illinois. https://farmdocdaily.illinois.edu/2020/04/further-evidence-on-the-time-it-takes-to-plant-the-us-corn-crop.html [accessed Apr 2022].
USDA-NASS. 2022. Quick Stats. USDA Nat’l Ag. Statistics Service. http://www.nass.usda.gov/Quick_Stats [accessed Apr 2022].
