

For those keeping track, last week’s article (“How likely will drought develop or worsen in Indiana”) and the article two weeks ago (“Nature’s faucets predicted to be turning off for the rest of the month”) had an overlapping theme – Indiana is behind in precipitation amounts from the climatological normals and the climate outlooks are not too confident that above-normal precipitation will catch the state up from its deficits.
Sigh.
Now, we are looking at precipitation forecasts over the next 7 days with amounts ranging from 4 to over 7 inches (Figure 1)! Locations such as Bloomington, Indiana are still dealing with flood conditions from last weekend’s storms and now more is coming. It is times like these that forecasters and climatologists brace for a lot of criticism and we prepare our responses around the need for funding to research what went wrong and how can things be improved for the future. One significant factor to realize is the climate outlooks consider a much broader spatial and temporal resolution. In other words, climate outlooks are meant more for locations the size of counties to states and for time periods weeks to months out. They do not capture individual storm events or even tropical storms that come up through the Gulf of Mexico that generate significant precipitation for the Midwest. Those storm events can impressively counter what a climate outlook model may have otherwise assumed would happen. With the amount of precipitation predicted in addition to how much rain fell across much of the state last weekend, let us hope that any drought or abnormally dry areas across the state will be eliminated and that flooding is kept to a minimum.
Figure 1. Seven-day precipitation prediction for Jun 24th through July 1st, 2021.
Regarding temperature, the outlooks tend to be a bit more reliable since storm events are less likely to disrupt temperature outlooks as much as precipitation outlooks. The current outlooks for the next few weeks are slightly favoring normal to below-normal conditions. This should hopefully keep heat index values low and outdoor conditions more pleasant. However, this will also likely slow the rate of growing degree day accumulations and evapotranspiration. Figures 2 and 3 show the latest modified growing degree-day accumulations and how this year’s accumulations compare to the most recent 4 years.

Figure 2. Modified growing degree day accumulations from April 1 to June 23, 2021.
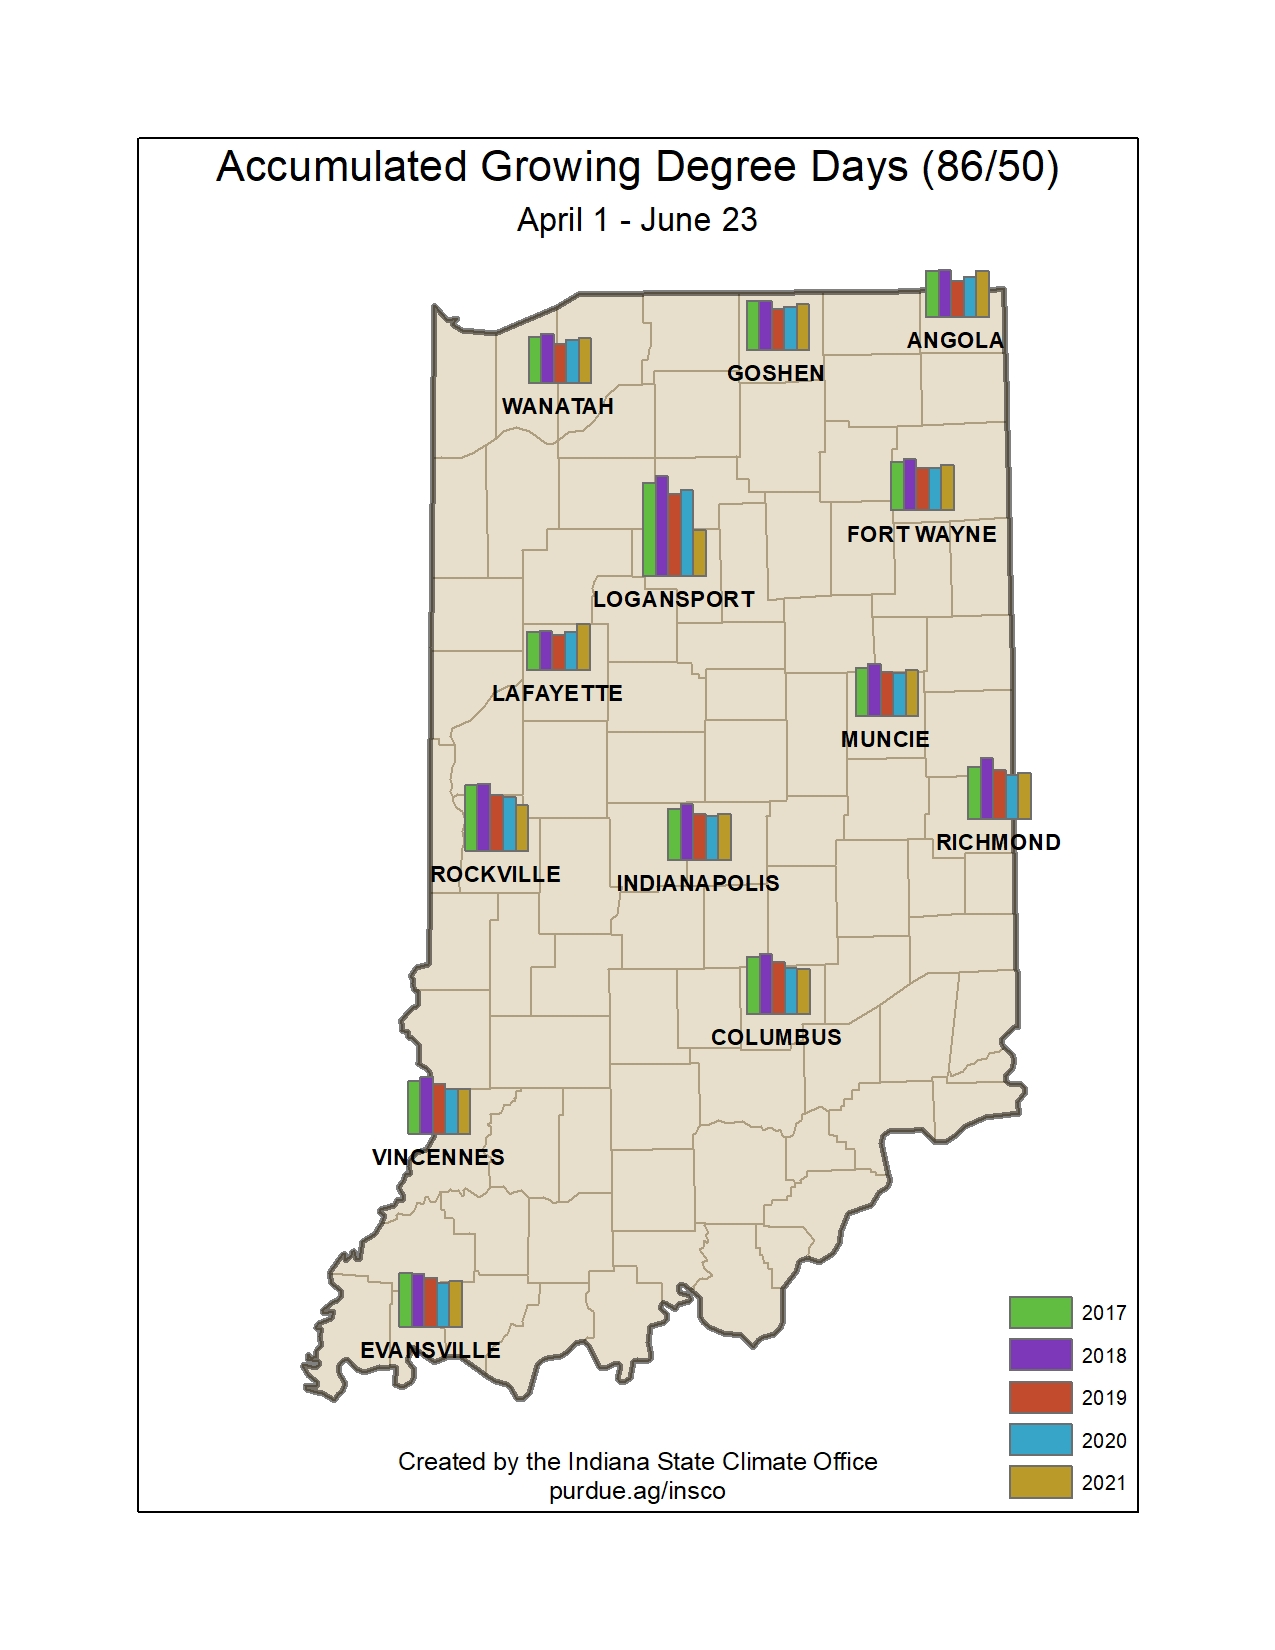
Figure 3. Comparison of 2021 modified growing degree day accumulations from April 1 – June 23 to the past four years.
