It is amazing to think that some part of Indiana has been in at least the Abnormally Dry category of drought on the US Drought Monitor for over a year. While it has not always been the same parts of the state, certainly northern Indiana has been the most consistently dry. Recently, however, the state has been in a wet pattern, helping to relieve most precipitation deficits. It seems when one half of the United States (US) is in a rather stagnant weather pattern, the other half experiences the opposite. Unfortunately, the western half of the US has been extraordinarily warm and dry. This is due to a blocking high pressure system that is forcing the jet stream to maintain a rather consistent pattern that encourages relatively cooler and wetter conditions in the eastern half of the country. Should that blocking high break apart or weaken, Indiana will likely see more typical transitions between wet and dry groups of days. It is possible that the weather patterns will shift and Indiana will be in an extended drier phase, but there are no strong indications at this time that an extended dry period will occur any time soon.
The latest climate outlook for the rest of July has too much uncertainty for most of Indiana with respect to temperature (i.e., climate models are favoring neither above- nor below-normal temperatures for the rest of the month). Precipitation for the rest of July is also not favoring abnormally wet or dry conditions with the exception of southeastern Indiana that has slightly enhanced chances for wetter-than-normal conditions.
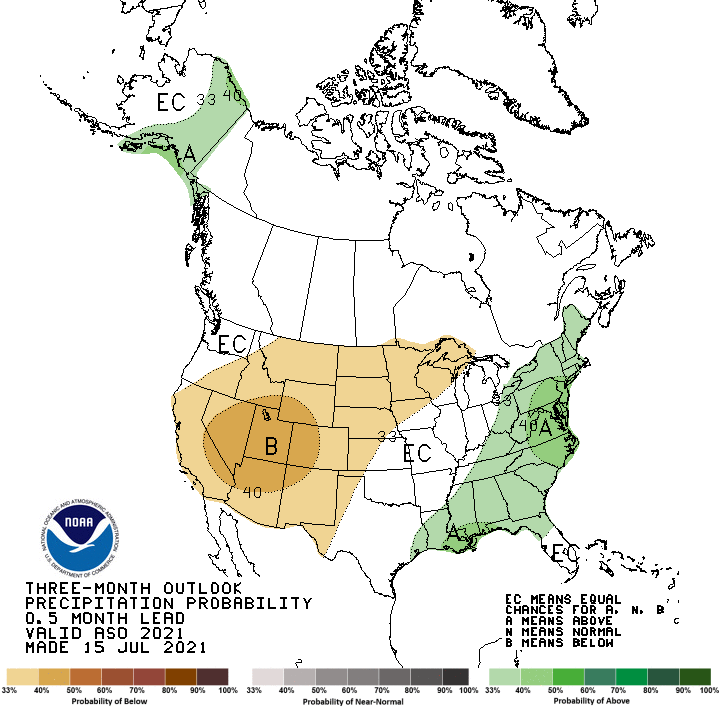
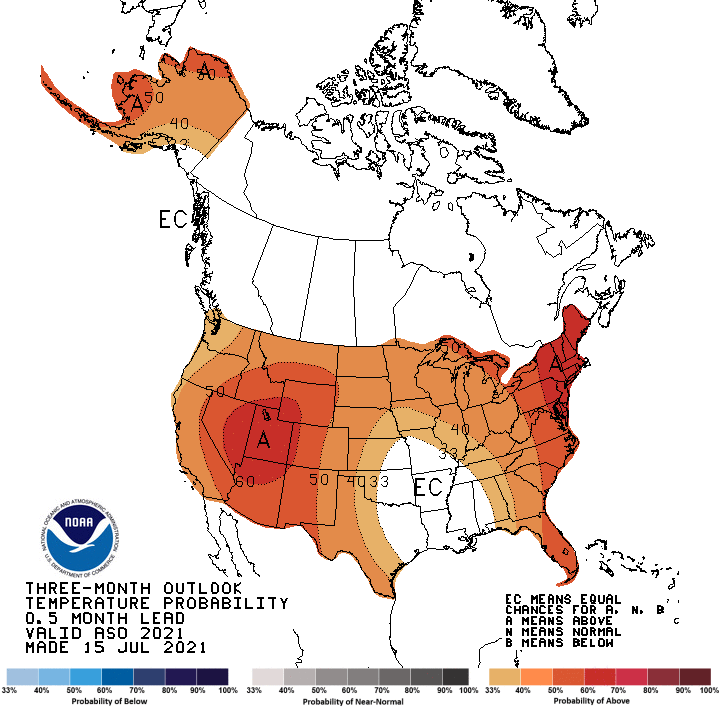
The three-month climate outlook – representing August-October – has equal chances for above, below, and normal precipitation amounts (Figure 1). However, there are enhanced chances for above-normal temperatures during this extended period (Figure 2). If the temperature outlook comes to fruition, that would imply increased evapotranspiration rates that could lead to abnormally dry or even moderate drought conditions depending upon the timing of any precipitation events.

Figure 1. National three-month climate outlook of precipitation relative to normal for August through September (source: Climate Prediction Center).

Figure 2. National three-month climate outlook of temperature relative to normal for August through September (source: Climate Prediction Center).
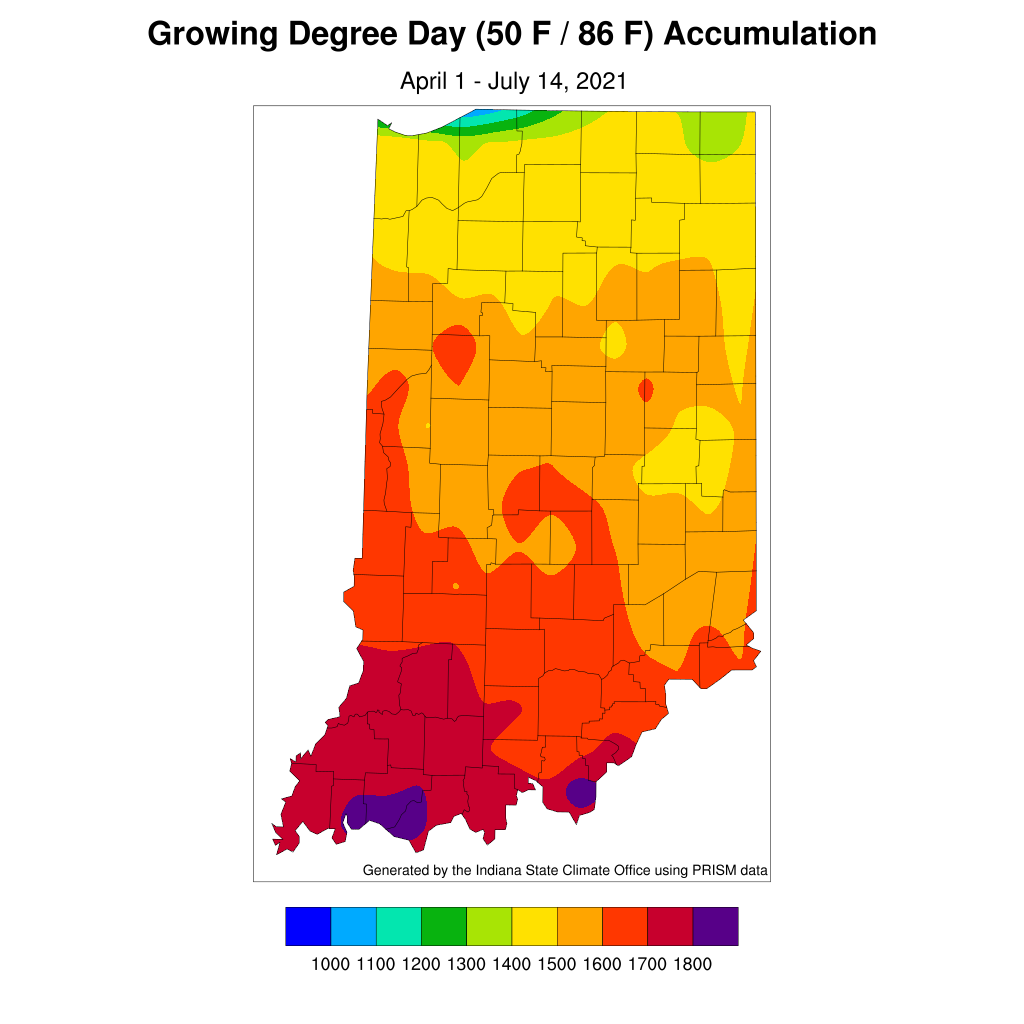
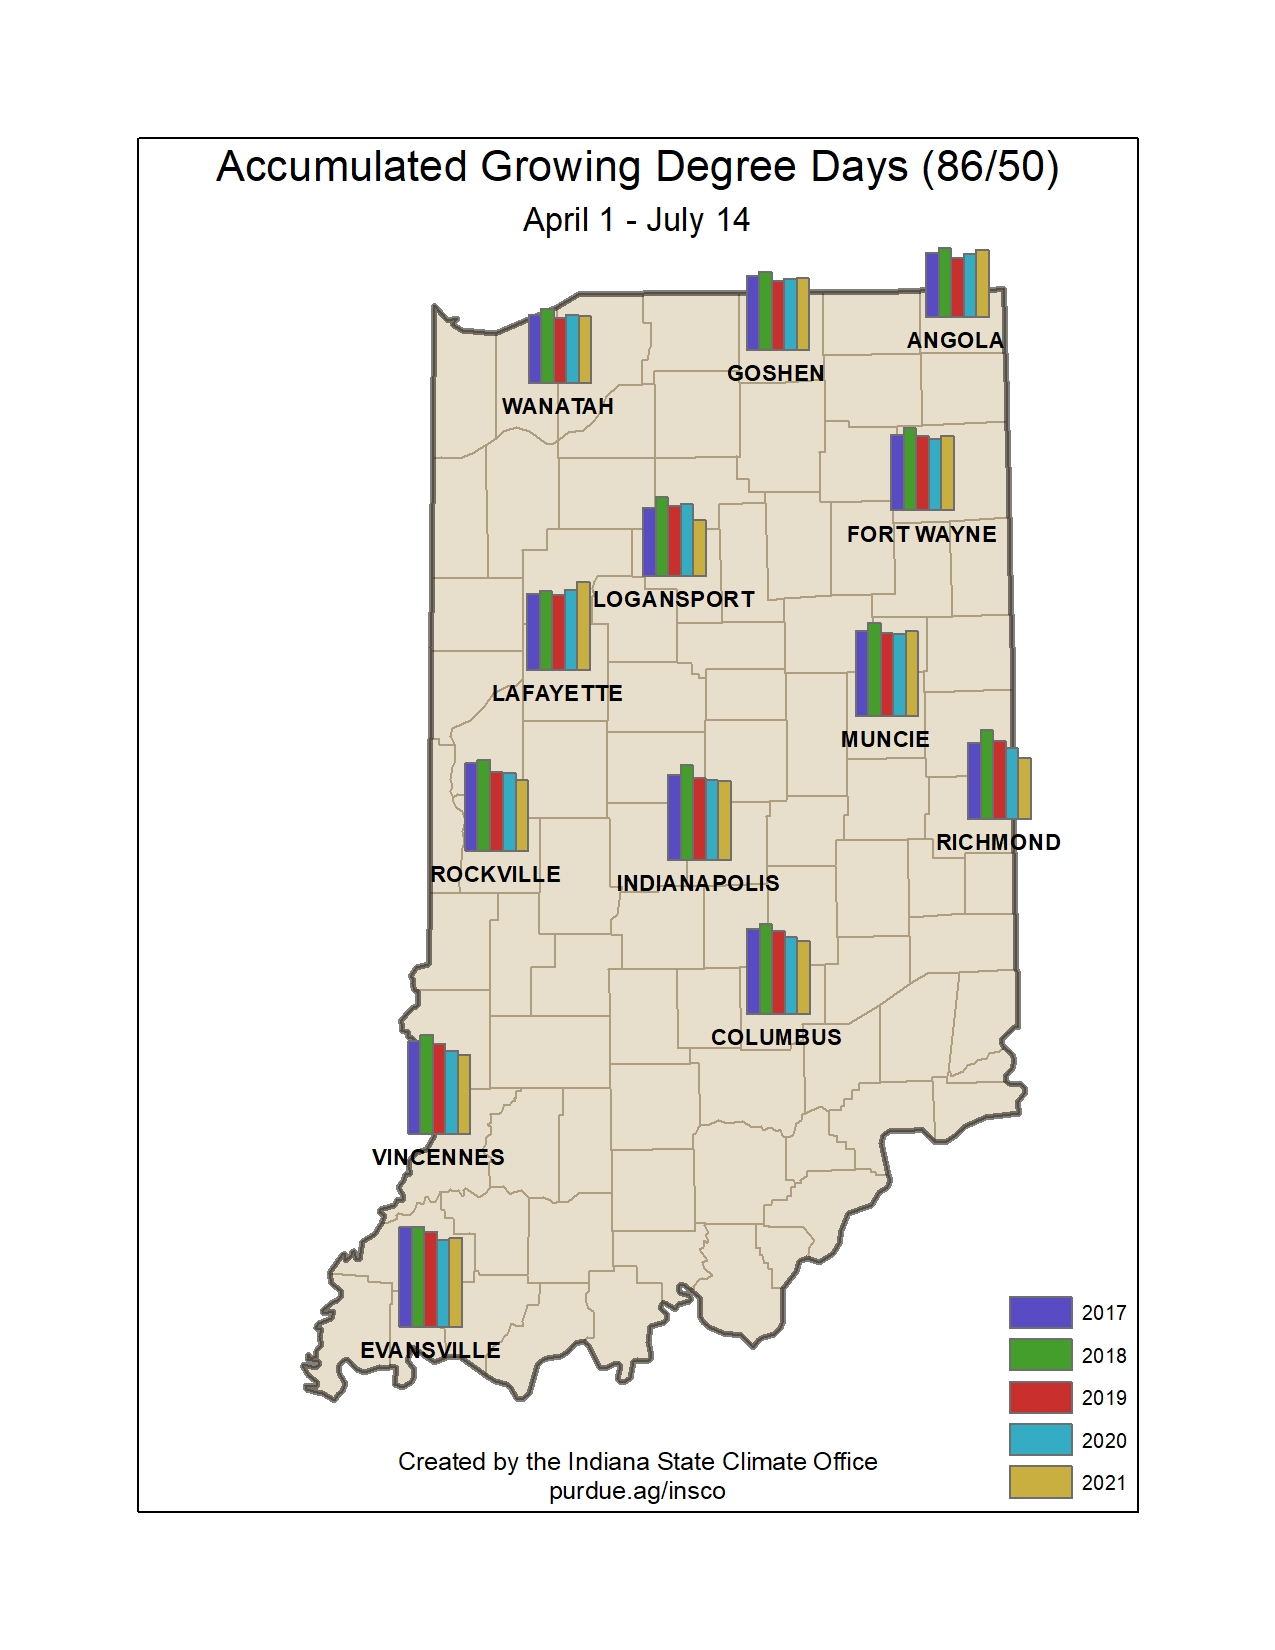
Modified growing degree-day accumulations now range from about 1300 to 1800 units across the state, with higher amounts to the south (Figure 3). From a climatological perspective, those amounts are slightly below normal across southern Indiana and slightly above normal for Indiana’s northernmost counties. However, departures are rarely greater than 100 units. Figure 4 illustrates the accumulation of MGDDs from April 1 through July 14th of this year compared to the most recent four years.


