

Fall and drought have been nearly synonymous in recent years; 2025 is no different. The September 30 US Drought Monitor, released on October 2, indicated that over 92 percent of the state was categorized as either abnormally dry (D0) or moderate drought (D1), with additional areas classified as severe drought (D2) or extreme drought (D3) (Figure 1). The driest part of the state extends from Fort Wayne to just east of Lafayette, with totals more than 4 inches below normal from August 2 – September 30 in spots. D3 conditions now exist in parts of Allen and Adams Counties, along with D2 conditions stretching westward to cover a large portion of north-central Indiana counties. A year ago, D3 reappeared in the state for the first time since August 2012, affecting parts of Franklin, Dearborn, and Ripley Counties for one week. This was temporary as remnants of Helene brought rain that alleviated drought conditions in southern Indiana. The addition of D3 in the state this week marks the second time this has occurred since the 2012 drought. Portions of Vermillion and Parke Counties have also had D2 lingering for several weeks. Heavy rains in southern Indiana have improved drought conditions slightly, with portions of the region now classified as D0, or ‘DNada’- a term for no drought.
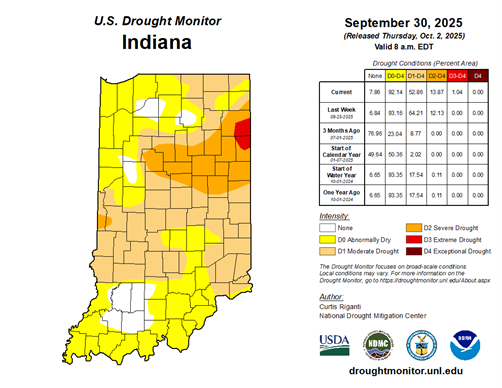
Figure 1: September 30, 2025, US Drought Monitor Map
The rapid onset of drought began in August. Using the Southern Regional Climate Center’s Climate Perspectives Tool, available for the Midwestern Region, I aimed to compare the total precipitation for August to September with historical data (Figure 2). Several stations in northern Indiana experienced their top 5 driest August to September on record. Marion, Indiana, recorded 2.19 inches over the two months, which was 5.26 inches below the 1991-2020 climatological normal. This was the driest August to September period Marion ever experienced, with records spanning more than 131 years of data. The Fort Wayne Airport had its fourth driest August to September on record, spanning 121 years of data. Drought impacts range from dormant lawns (a welcome break from mowing, though) to the lowest water levels some have seen in ponds, reduced streamflows, rapidly drying crops, premature tree leaf drop, and various other effects.
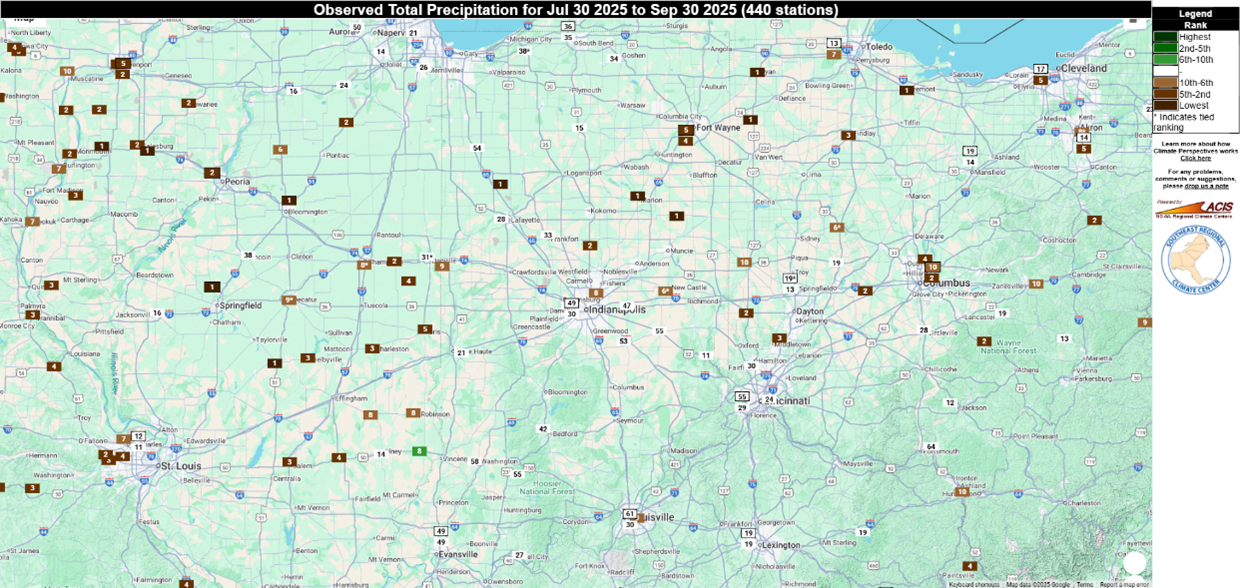
Figure 2: Climate Perspectives Tool displaying July 30 – September 30 station ranked precipitation totals.
So where do we go from here? Fortunately, we have some precipitation forecast between October 2 and October 9, 2025. The heaviest totals appear to be in central and eastern Indiana, with over an inch in most spots, and up to 2 inches in others (Figure 3). Fingers crossed, let’s hope we get this precipitation. The Climate Prediction Center has elevated confidence in above-normal precipitation statewide through mid-October. This is a complete shift from the pattern that has been locked in for what seems like weeks.
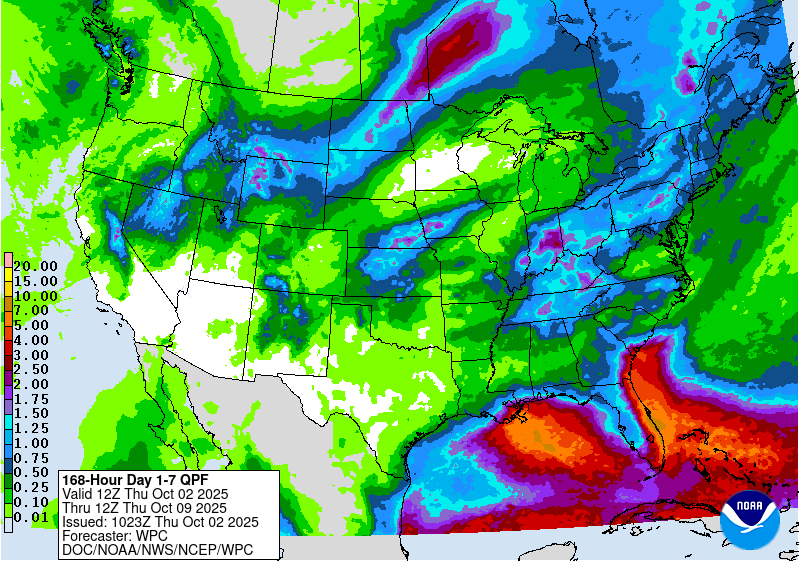
Figure 3: Day 1-7 Quantitative Precipitation Forecast Valid 8:00 AM ET October 2 – 8:00 AM ET October 9.
