

Summary
Sulfur (S) deficiency is becoming more common in Indiana crops because, in part, S deposition from coal-fired power plants has been reduced. Large plot strip trials were conducted at several locations from 2017-2021 to examine corn yield response to S applied as ammonium thiosulfate (ATS) in starter and/or sidedressed nitrogen (N) fertilizers. Grain yield was increased by sidedress S in 15 of 40 trials. In those 15 responsive trials, the average yield benefit to S fertilization ranged from 4 to 24 bu/acre, averaging 12 bu/acre. Application of S reduced yield in 3 of 40 trials. In 2 trials, 5 lb S/acre applied at sidedress reduced yield compared to no S applied or higher S rates. In another trial, 15 lb S/acre reduced yield 2.3 bu/acre compared to no S applied. Sulfur in starter fertilizer as the only source of applied S and at rates of 5 lb S/acre or less, was only beneficial in 1 of 9 trials. Applying S in starter and sidedress was no better than applying S only in sidedress. A summary of our sulfur research can be viewed on YouTube at https://youtu.be/XFV6vUpgphI .
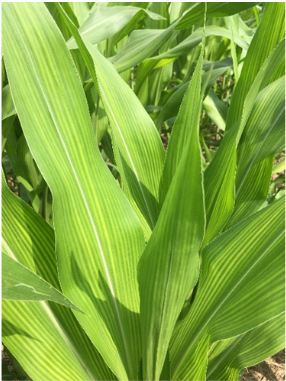
Figure 1. Sulfur deficiency symptoms in corn.
Sulfur Deficiency
Sulfur (S) deficiency has become more common in Indiana crops because S emissions from coal-fired power plants have decreased over the past few decades (Camberato and Casteel, 2017). Consequently, atmospheric S deposition to soils has also decreased.
Sulfur deficient corn plants exhibit a general yellow-green color from top to bottom of the plant, often also with visible leaf striping (Fig. 1). Other nutrient deficiencies can cause striping and can sometimes be confused with S deficiency (Camberato, 2013). Nitrogen deficiency on the other hand, will usually have green leaves emerging from the whorl while the lower leaves turn yellow from the tip through the mid-rib, then turn brown, and quickly wither away. Tissue S levels less than 0.15 – 0.18% and tissue sample N:S ratios greater than 15:1 – 20:1 are considered reasonably good indicators of S deficiency in corn.
Sulfur Response Trials
Starter fertilizer S
We conducted 9 field-scale trials exploring the impact of starter and/or sidedress S on corn yield in 2017 and 2018. To provide S we mixed ammonium thiosulfate (ATS) with urea ammonium nitrate (UAN-32% or 28%) or a mixture of UAN and ammonium polyphosphate (10-34-0) as a starter fertilizer in 2×2 placement and/or as ATS with UAN as a sidedress application. Rates of S ranged from 3-5 lb S/acre as starter and 12-25 lb S/acre as sidedress. Sidedress fertilizer was injected in the row middle to a depth of 2-4 inches at corn growth stages between V5 and V7 (all but one trial).
Starter fertilizer alone, compared to no S, had no effect on yield in 8 of 9 trials. Interestingly, three of those trials were actually S deficient and responded to higher rates of S at sidedress with yield increases from 15 to 20 bu/acre. Sidedress alone at 15-25 lbs S was as good or better than splitting S between starter (5 lbs S) and sidedress (remainder of S). In the one trial in which starter S increased yield, compared to no S applied, sidedressing an additional 10 or 20 lb S/acre did not increase yield any more than starter alone.
Grain yield response to S supplied in sidedress applications
To determine the effect of sidedress S on corn grain yield, 40 field-scale trials (including the 9 with starter S treatments) were conducted at several sites from 2017-2021 (Fig. 2). Multiple rates of sidedress S were utilized in 26 of the 40 trials, ranging from 5 to 30 lb S/acre and always including a 0 lb S/acre treatment. Fourteen trials only had 2 S rates, 0 and 15 lb S/acre (mostly in 2021). Sidedress S was applied as described in the previous section.
Sidedress S increased yield in 15 of 40 trials (Fig. 2), ranging from 4 to 24 bu/acre averaged over the entire experimental area. In 7 trials where corn responded to multiple rates of sidedress S, the lowest sidedress rate examined (ranging from 5 to 20 lb S/acre) was enough to maximize the yield response.
Even at sites that had large yield increases with S fertilization in some years, no response occurred in other years. Several sites were consistently unresponsive to S fertilization over several years of testing – Purdue research farms in Whitley, Jay, and Tippecanoe counties – even though responses to S were obtained at other sites near these farms.
Yield decreases with S fertilizer occurred in only 3 of 40 trials. In 2 trials, 5 lb S/acre applied at sidedress reduced yield compared to no S applied or higher S rates. In another trial, 15 lb S/acre reduced yield 2.3 bu/acre compared to no S applied.
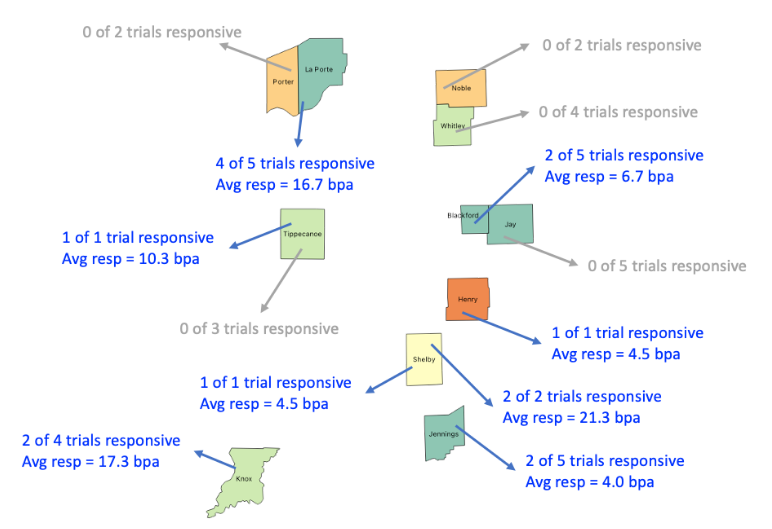
Figure 2. Effect of fertilizer S on corn grain yield in 40 field scale trials conducted throughout Indiana, 2017-2021. All the positive yield responses were sidedress S apart from 1 trial in Jennings County that was starter S (bpa = bushels per acre).
No soil properties (including extractable sulfate-S, organic matter, and texture) or pre-sidedress plant tissue %S or N:S ratio consistently separated responsive from non-responsive sites, although some sites affirmed previous research which suggested S deficiency would be more likely and more severe on sandy low organic matter (OM) soils. For example, the LaPorte site is composed of loamy sand and sandy loam soils and averaged 2% OM. At this site S fertilization increased corn yield in 4 of 5 years, averaging 16.7 bu/acre. Similarly, in another site with substantial soil variability, S increased yield 10 bu/acre on a Whitaker silt loam (2.1% OM), while there was no response to applied S on a Bono silty clay (3.9% OM). However, the opposite occurred in a trial in Shelby County where the yield response to S was 35 bu/acre on soil mapped as Brookston silty clay loam (2.6% OM), while there was no response to S on soil mapped to the lighter-textured lower OM Crosby silt loam (1.9% OM). Other sites with clayey soils and high %OM have also had substantial responses to applied S – for example a Chalmers silty clay loam soil with 3.9% OM in Tippecanoe County. Work continues to identify soil, plant, and environmental measurements that improve our ability to predict corn yield response to S fertilization.
Although tissue sampling prior to sidedress did not identify sites requiring S fertilization, measuring earleaf tissue %S or the tissue N:S ratio in the earleaf at silking were useful in identifying S deficiency. Current guidelines for adequate S in the earleaf at silking suggest Figure 2. Effect of fertilizer S on corn grain yield in 40 field scale trials conducted throughout Indiana, 2017-2021. All the positive yield responses were sidedress S apart from 1 trial in Jennings County that was starter S (bpa = bushels per acre). 4 greater than 0.15% S is sufficient. Our work suggests the critical level for sufficiency may be higher, greater than 0.18% (Fig. 3). The N:S ratio of plant tissue concentrations is also used to assess S deficiency in corn. Sulfur and N are primary components of plant protein and typically occur in a ratio of about 15 parts N to 1 part S (15:1 N:S). Greater N:S values suggest S is deficient. Our results are consistent with this assessment, with most of the responsive locations having a N:S ratio of 16:1 or greater (Fig. 4).
Neither % or N:S are perfect at separating responsive and non-responsive sites, so if tissue levels are near or below these critical levels or S deficiency symptoms were noticed you should consider conducting simple S response trials on your farm next year. A simple protocol for conducting these trials can be downloaded at https://www.agry.purdue.edu/ext/corn/ofr/protocols.html. We would be eager and willing to partner with you in conducting these trials.
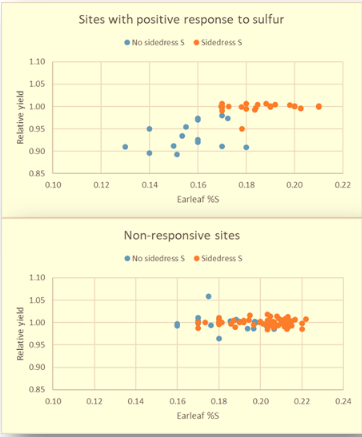
Figure 3. Earleaf tissue S concentrations at sites with positive responses (top) and non-responsive to S fertilization (Bottom). Blue symbols indicate treatments not receiving S fertilizer. Relative yield is yield of the no S treatment divided by yield obtained with S. Data are from 13 responsive and 21 non-responsive sites.
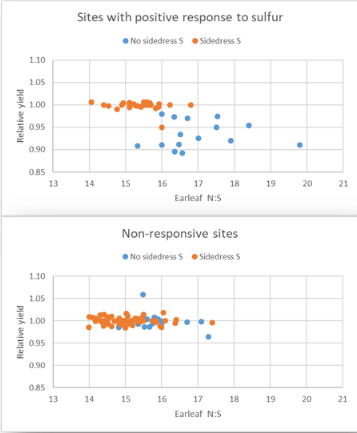
Figure 4. Earleaf tissue concentration N:S ratios at sites with positive responses (top) and non-responsive to S fertilization (bottom). Blue symbols indicate treatments not receiving S fertilizer. Relative yield is yield of the no S treatment divided by yield obtained with S. Data are from 13 responsive and 21 non-responsive sites.
Sulfur fertilization decisions
Not every field of corn is deficient for sulfur and so we do not recommend that everyone routinely apply S fertilizer to every single field they farm. Unfortunately, based on the results of on-going research, there is yet no consistent soil or plant predictor that accurately tells us where and when S fertilization of corn will be needed.
Sulfate-S analysis from fall soil samples is not helpful and we have found that even soil samples taken between planting and sidedress time are not helpful in determining whether a field needs S fertilization. The reason for this is that soil sulfate-S is subject to leaching from excessive rainfall, like soil nitrate-N, and soil-test S does not adequately reflect the organic-S that may come available during the growing season.
Our research also suggests that tissue analyses of plant samples taken just before sidedressing are also not reliably predictive of S needs by the corn plant, WITH THIS CAVEAT – If plants are (1) showing S deficiency symptoms prior to sidedressing and (2) plant tissue analyses show that %S is very low (approaching 0.12%) and (3) the N:S ratio of the plant tissue concentrations is very wide (>24:1), then S fertilization is likely needed. We typically don’t see these levels of %S and N:S at sidedress time in our research trials, but we encounter them occasionally when troubleshooting problem fields. Although it is possible the crop will grow out of such early season deficiency as soils warm, organic matter mineralization increases, and roots explore more soil, it is more likely that an application of 10-15 lb S/acre will be needed to provide non-limiting conditions. Furthermore, since our research indicates that [sidedress alone] is just as good or better at relieving S deficiency than [starter plus sidedress], delaying the decision to apply S based on symptoms and tissue analysis between planting and sidedress is a reasonable strategy.
Low rates of S as starter alone (<5 lb S/acre) have not increased corn yields in our trials. Higher starter rates might be beneficial but, unfortunately, we have not conducted field research with higher starter rates to answer that question. We caution against applying 10-15 lbs of S in the form of ATS in 2×2 or closer starter placements without on-farm testing of your own because ATS can result in plant toxicity.
The risk of soil sulfate-S loss increases the farther ahead of planting S fertilizer applications are made. Counting on plant available S from elemental S is risky since availability is reliant on warm soil temperatures. Plant availability of S applied as elemental S in fall and winter is no different than a spring application because conversion to sulfate won’t occur till soils warm substantially. Even fertilizers claiming accelerated elemental S conversion to sulfate because of very small particle sizes include a sulfate component to provide plant available S soon after application.
What is the minimum effective rate of S to apply? Our research suggests that 10-15 lbs S/acre, applied just before planting but no later than sidedressing, will be adequate in most S-deficient situations. Broadcast applications of sulfate-S at/or shortly after early season plant sampling should be similarly effective as knife/coulter sidedress S applications.
Related References
Camberato, Jim. 2013. Striped Corn – Potential Nutrient Deficiencies. Sulfur Deficiency. Soil Fertility Update, Agronomy Dept., Purdue Univ.
https://ag.purdue.edu/agry/extension/Documents/Soil%20Fertility/Striped%20corn%202013%20URL.pdf [Accessed Jan 2022] .
Camberato, Jim and Shaun Casteel. 2017. Sulfur Deficiency. Soil Fertility Update, Agronomy Dept., Purdue Univ. https://ag.purdue.edu/agry/Documents/Sulfur%20deficiency%202017.pdf [Accessed Jan 2022].
Nielsen, RL (Bob) and Jim Camberato. 2021. What We Know & What We Don’t Know About Corn Response to Sulfur in Indiana. Agronomy Dept., Purdue Univ. YouTube: https://www.youtube.com/watch?v=XFV6vUpgphI [Accessed Jan 2022].
_______________________
Acknowledgements: Indiana Corn Marketing Council, Pioneer Hybrid Intl., Beck’s Hybrids, A&L Great Lakes Laboratories, Purdue Agricultural Centers, and farmer cooperators. This work was supported by the USDA National Institute of Food and Agriculture, Hatch Project 1010713.
