

Seed corn represents one of the most expensive variable input costs for Indiana corn growers (Langemeier et al., 2021) and so choosing the most economical seeding rate is important for maximizing dollar return to seed at harvest time. Choosing the most economical seeding rate involves balancing the cost of the seed corn and the price you expect to receive for the harvested grain when you sell it. Just as importantly, the most economical seeding rate depends on the yield response of corn to final PLANT POPULATION.
Jim and Bob conducted nearly 100 field scale trials around Indiana from 2008 through 2019 to document the yield response of corn to PLANT POPULATION. The complete summary of that research is available online (Nielsen et al., 2019).
Figure 1 below was derived from that summary and illustrates (1) the average yield response of corn (in terms of percent yield) to final PLANT POPULATION and (2) the average dollar return to seed for 83 trials that represented a range of growing conditions that we characterized as “normal” for Indiana. In particular, none of those 83 trials experienced severe drought conditions. Yield levels among those 83 trials ranged from about 150 to 250 bushels per acre and across the entire set of trials, the average yield level was 194 bushels per acre.
Based on the yield response curve (blue data points), we can determine that maximum (100%) corn yield occurred at a final PLANT POPULATION of about 32,000 PLANTS per acre. However, note how “shallow” or nearly “flat” the yield response curve is for those 83 trials. That “flatness” reflects the tolerance of today’s hybrids to higher populations, much more so than hybrids of “yesteryear”. Note also how tolerant today’s hybrids are to lower populations. The tolerance to both low and high populations results in the shallow response curve. In fact, our data suggest that potential yield at final PLANT POPULATIONS ranging from about 28,000 to 35,000 PLANTS per acre at harvest varies by only +/- 1 bushel per acre at yield levels around 200 bushels per acre!
The dollars and cents upshot of such a shallow yield response curve is that when the POPULATION is near the optimum to start with, “squeezing” one more bushel per acre by increasing seeding rate requires more seed than you can afford. In Fig. 1, the curve representing dollar return to seed (red data points) illustrates that point. The average ECONOMIC PLANT POPULATION for our 83 trials was closer to 27,000 PLANTS per acre, or about 5,000 fewer PLANTS per acre than the AGRONOMIC OPTIMUM POPULATION that maximizes grain yield.
Obviously, the ECONOMIC OPTIMUM POPULATION is influenced by market corn price and seed corn cost. Table 1, also available in our complete online summary, provides estimates of ECONOMIC PLANT POPULATIONS for a range of seed corn costs and market grain prices.
Seeding Rate versus Plant Population?
The astute reader will have noticed our use of the capitalized term “PLANT POPULATION”. The reason for that is corn responds to the actual plant population in the field, not simply the seeding rate because percent stand success is rarely 100%. In our own field trials, percent surviving stand averaged 95%. For other folks, that number may be 90% or 98% or 85%.
Assuming you know your typical percent stand from past field scouting, then you can calculate the seeding rate that targets a desired economic optimum plant population by simply dividing the target PLANT POPULATION by the percent stand. For example, if you are aiming for a final stand of 30,000 PLANTS per acre and your average percent stand success is 95%, then the seeding rate to achieve that target would be 30,000 divided by 0.95, which would equal a seeding rate of about 31,600 SEEDS per acre.
Impact on Variable Rate Decisions?
The “flat” grain yield response of corn to plant population should give you pause for thought relative to variable seeding rate decisions. Our data (Fig. 1) tells us that maximum grain yield occurs within a WIDE range of plant populations, from about 28,000 to 35,000 plants per acre, for most productive, non-droughty soils throughout the state. Interestingly, most variable rate “prescriptions” that farmers have shared with us also fall within the range of about 28,000 to 35,000 plants per acre. Most of these farmers tell us they are “pleased” with the results and believe that VR seeding helped them improve yields and/or profit. When pressed, many admit they do not actually have any valid comparisons with uniform seeding rates.
In field trials where we have looked at yield response to a range of plant populations in different “management zones” (soil types, elevation, etc.), we rarely see any difference in optimum final plant populations. The exception is when there are areas in a field subject to severe drought stress. The optimum PLANT POPULATION for drought prone areas of fields is obviously lower than for areas with adequate soil moisture. Data from 14 of our field trials that suffered severe drought stress suggests that the optimum population for droughty fields or areas within fields is 5,000 to 10,000 fewer PLANTS per acre than for less droughty areas.
Hybrid Response to Plant Population?
We have rarely observed any CONSISTENT and REPEATABLE differences among hybrids in their yield responses to PLANT POPULATION. However, since seed corn prices can vary among hybrids, the ECONOMIC OPTIMUM PLANT POPULATION may vary among hybrids and can be visualized with the data in Table 1. If one hybrid costs $175 per bag and another costs $350 per bag, then their respective ECONOMIC OPTIMUM PLANT POPULATIONS would be 28,645 and 25,501 PLANTS per acre, respectively (using a $5 market price for grain).
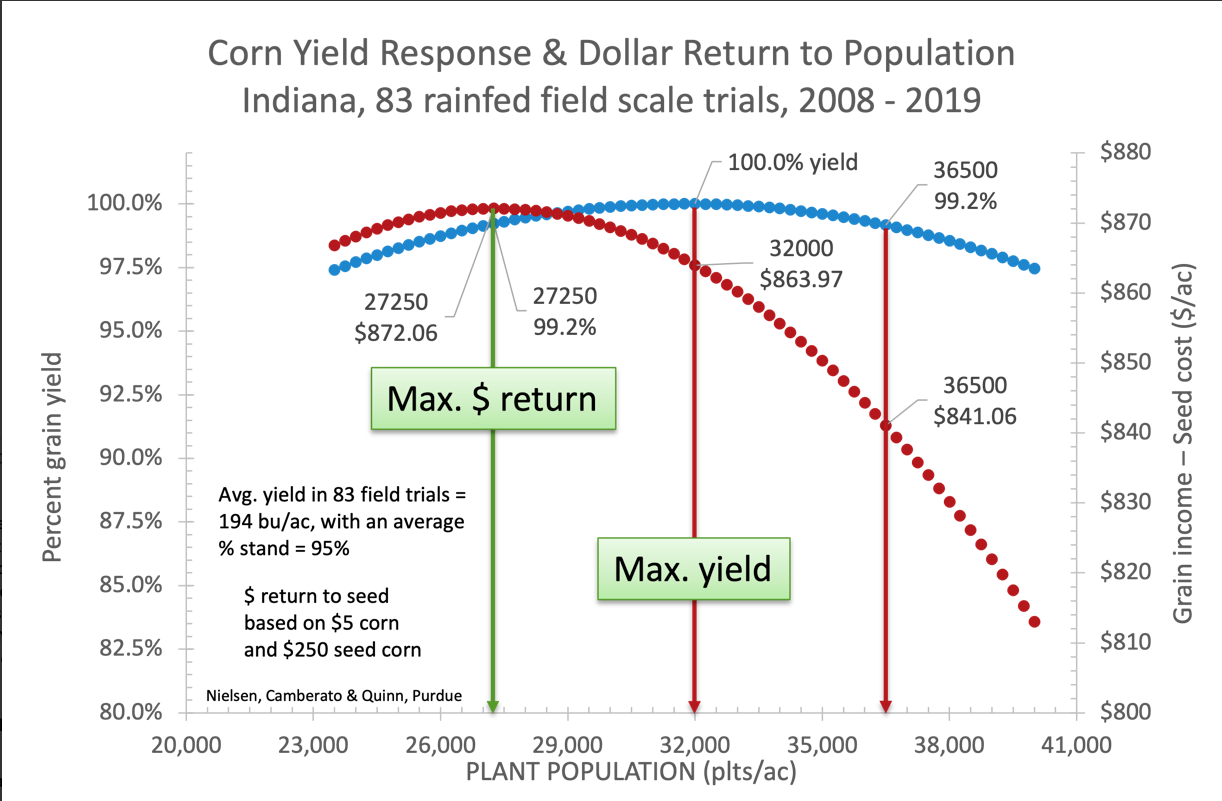
Fig. 1. Average corn yield response and dollar return to seed, based on the aggregated results of 83 field scale trials conducted across Indiana from 2008 to 2019. These trials represented a normal range of growing conditions (minimal to moderate stress). The agronomic optimum PLANT POPULATION for this group of trials was 31,800 plants per acre at harvest with an average yield of 194 bushels per acre. The economic optimum PLANT POPULATION for this group of trials occurred at 27,250 PLANTS per acre, based on the average maximum yield of 194 bushels per acre, $5.00 corn grain price, and $250 per 80,000 seed bag of seed corn.
| Table 1. Plant Populations that maximize marginal return to seed relative to grain price (per bu.), seed cost (per 80,000 seed bag), a 95% success of stand establishment, and the average yield response to population in 83 field scale trials in Indiana that represented a common range of growing conditions. NOTE: To calculate seeding rates from the values of this table, divide by your expected percent stand. For example, 30,000 plants per acre divided by 95% stand = 30,000 divided by 0.95 = 31,589 seeds per acre. | |||||||||
|---|---|---|---|---|---|---|---|---|---|
| Grain $ | |||||||||
| Seed $ | $3.00 | $3.50 | $4.00 | $4.50 | $5.00 | $5.50 | $6.00 | $6.50 | |
| $175 | 26549 | 27298 | 27859 | 28296 | 29645 | 28931 | 29169 | 29371 | |
| $200 | 28500 | 26656 | 27298 | 27797 | 28196 | 28523 | 28795 | 29025 | |
| $225 | 25051 | 26014 | 26736 | 27298 | 27747 | 28114 | 28421 | 28680 | |
| $250 | 24303 | 25372 | 26174 | 26798 | 27298 | 27706 | 28046 | 28334 | |
| $275 | 23554 | 24731 | 25613 | 26299 | 26848 | 27298 | 27672 | 27989 | |
| $300 | 22805 | 24089 | 25051 | 25800 | 26399 | 26889 | 27298 | 27643 | |
| $325 | 22057 | 23447 | 24490 | 25301 | 25950 | 26481 | 26923 | 27298 | |
| $350 | 21308 | 22805 | 23928 | 24802 | 25501 | 26072 | 26549 | 26952 | |
Reference List
Langemeier, Michael R., Bob Nielsen, Tony J. Vyn, Shaun Casteel, and Bill Johnson. December 2021. 2022 Purdue Crop Cost & Return Guide. Purdue Extension Publ. ID-166-W. https://ag.purdue.edu/commercialag/home/resource/2021/12/2022-crop-cost-and-return-guide/ [URL accessed Jan 2022].
Nielsen, RL (Bob), Jim Camberato, and Jason Lee. 2019. Yield Response of Corn to Plant Population in Indiana. Applied Crop Production Research Update, Purdue Univ. Dept. of Agronomy. http://www.kingcorn.org/news/timeless/CornPopulations.pdf [URL accessed Jan 2022].
